
Figure 5. MET-PET reveals very early treatment response in vivo.
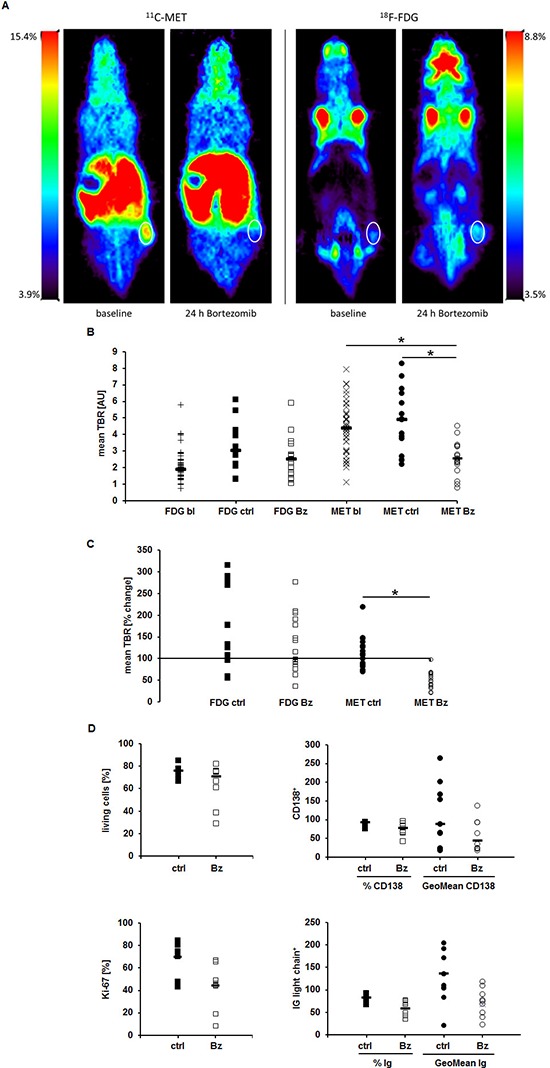
MM.1S tumors in Nod.Scid mice were imaged at baseline and 24 h after administration of Bz using MET- and FDG-PET, respectively. (A) Coronal views of an exemplary mouse. (B) Mean TBRs of FDG and MET at baseline (bl), in the control (ctrl) and treatment (Bz) group. (C) Relative change in tracer-uptake by tumors (mean TBR) in individual mice 24 h post treatment initiation compared to baseline. (D) FACS analyses evaluating dead cells (top left), CD138 (top right) and intracellular Ig light chain (bottom right) expression. Proliferation (bottom left) was assessed histologically by Ki-67 staining on paraffin embedded sections. Horizontal lines indicate the median in each group. Asterisk indicate statistical significance (p < 0.02). Differences in (D) are not statistically significant.