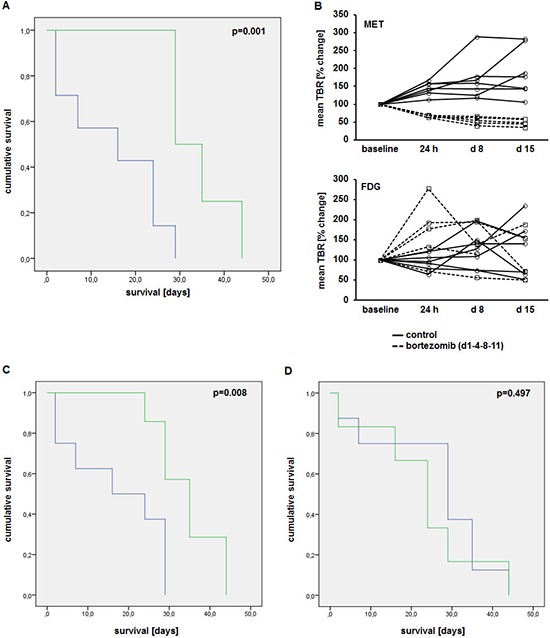
Figure 6. Early reduction in MET uptake correlates with improved survival.

(A) Kaplan-Meier-curve of animals treated with bortezomib (d1-4-8-11; n = 7; green) and control group (n = 8; blue). (B) Tumor-to-background ratios of MET (top) and FDG (bottom) uptake in treatment (dashed lines)- and control (solid lines) group at baseline, 24 h, 8d and 15d after treatment initiation. Correlation of changes in MET (C) and FDG (D) uptake 24 h post treatment initiation with survival (green, responders; blue, non-responders).
