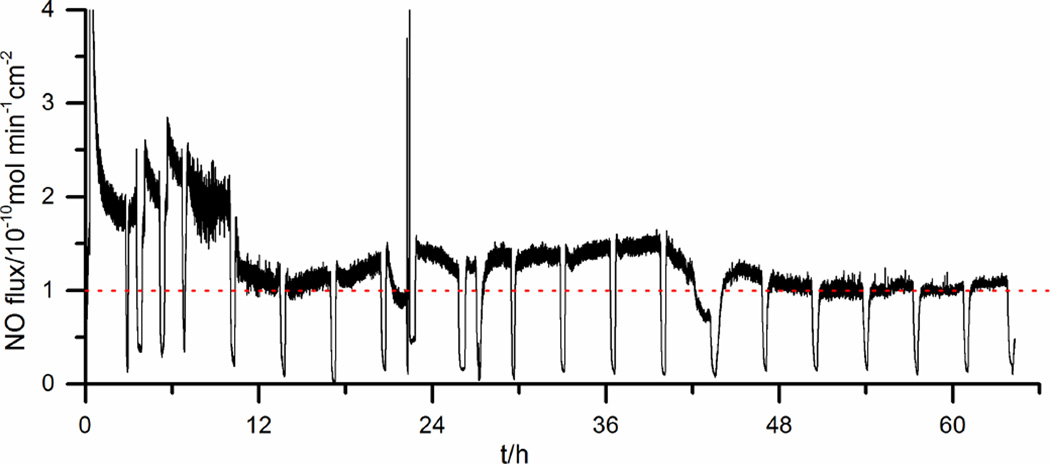
Fig. 3.
NO release from a single-lumen silicone catheter using repeated pulse cycles of 15 s at −1.3 V and 15 s at +0.2 V at 37 °C. The dotted line indicates a surface NO flux of 1.0×10⁻¹⁰ mol min−1 cm−2. Note that the catheter is intentionally turned “off” periodically to demonstrate the NO release can be modulated. The potentials are vs. Ag/AgCl wire

