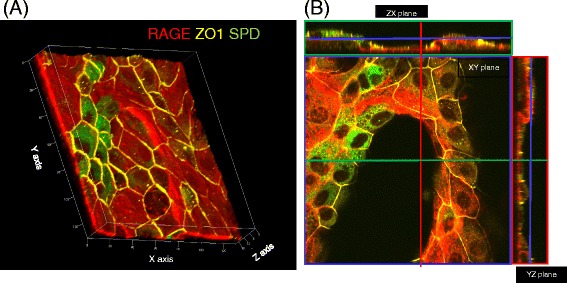
Fig. 10.

Effect of Gap26 on AECs cultured on BMSCs. a Three-dimensional images of AECs in direct contact with BMSCs treated with Gap26. b Orthogonal section analysis of image. Green, red, and blue rectangles show the sectional images at the level of the line with the corresponding color. Cells were stained with antibodies against RAGE (red), SP-D (green), and ZO-1 (yellow)
