
Fig. 9.
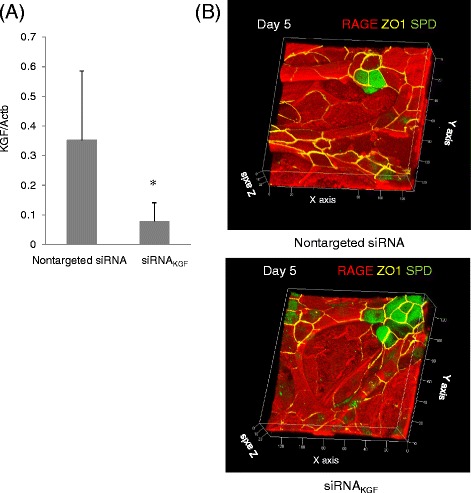
Effect of siRNA knockdown of KGF on AECs cultured on BMSCs. a Comparison of the abundance of KGF transcript between cells treated with siRNA for KGF expression (siRNAKGF) and cells treated with non-target siRNA (Control). *P < 0.05 vs. non-target siRNA. b Three-dimensional images of AECs in direct contact with BMSCs with or without KGF knockdown. Upper panel shows cells treated with non-target siRNA, and the lower panel shows cells treated with siRNAKGF. Cells were stained with antibodies against RAGE (red), SP-D (green), and ZO-1 (yellow)