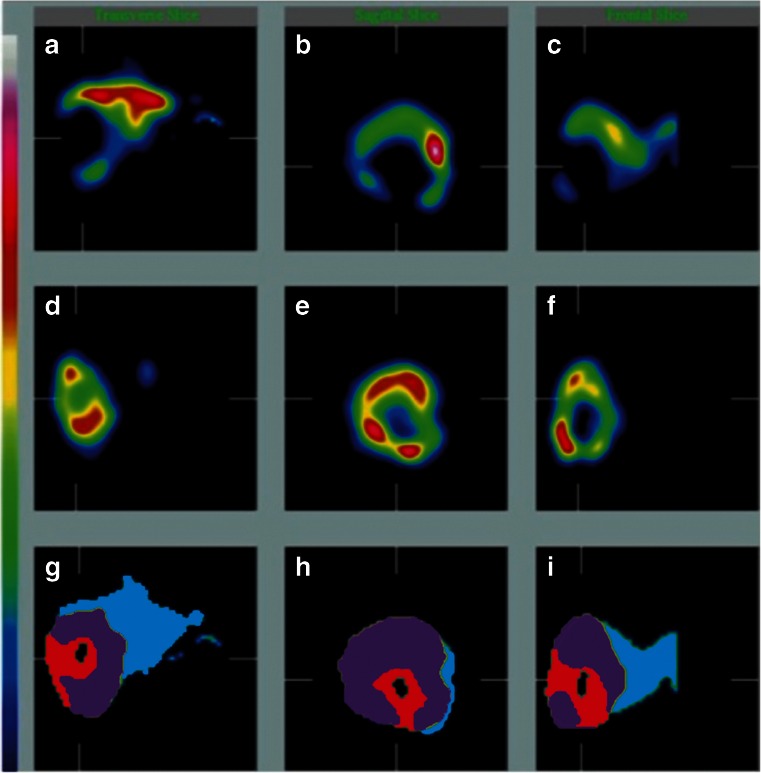
Fig. 2.
Functional liver tissue defined by TcSC SPECT images in three orientations (axial, sagittal, coronal, a–c), simulated 90Y distribution defined by TcMAA SPECT images in three orientations (d–f), and the coregistered fused SPECT images in three orientations (g–i), resulting in the definition of four different compartments: tumour (red), tumour necrosis (black), irradiated functional liver (purple), and unirradiated functional liver (blue)

