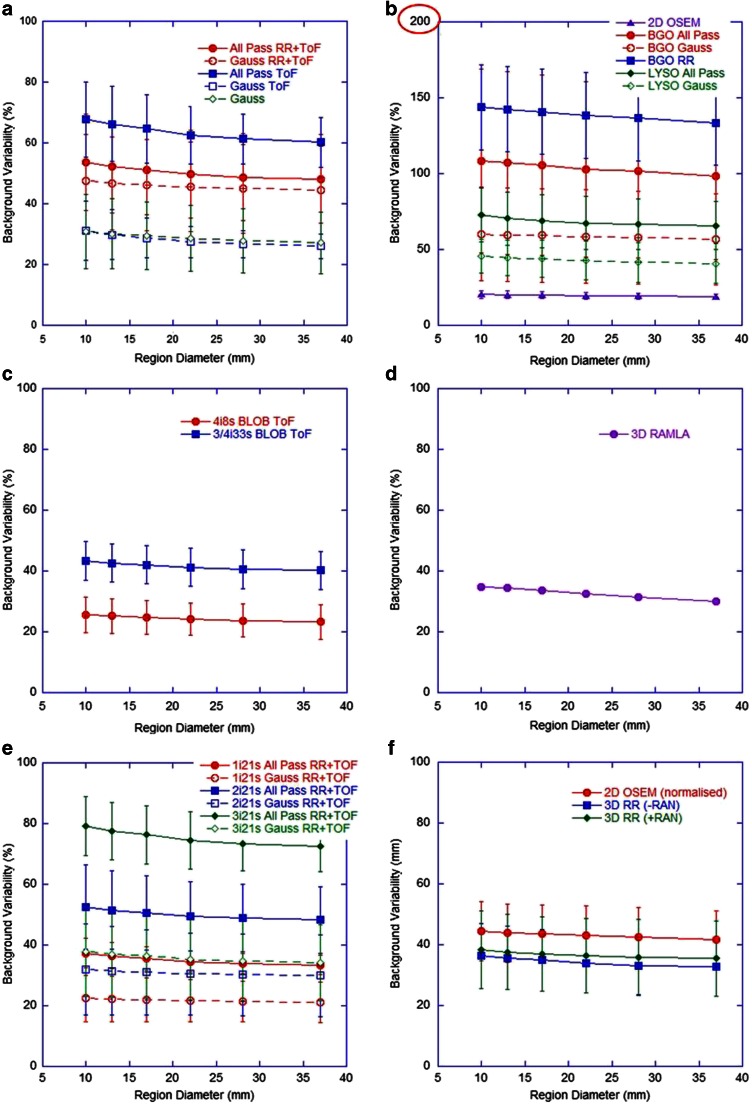
Fig. 7.
Background variability for different region diameters for (a) GE Healthcare ToF systems, (b) GE Healthcare non-ToF systems (note different scale on the y-axis), (c) Philips ToF systems, (d) Philips non-ToF systems, (e) Siemens ToF systems, (f) Siemens non-ToF systems (where +RAN and -RAN correspond to data acquired in ‘PROMTS + RANDOMS’ and ‘NETTRUES’ mode, respectively, and where -RAN was normalized for analysis)

