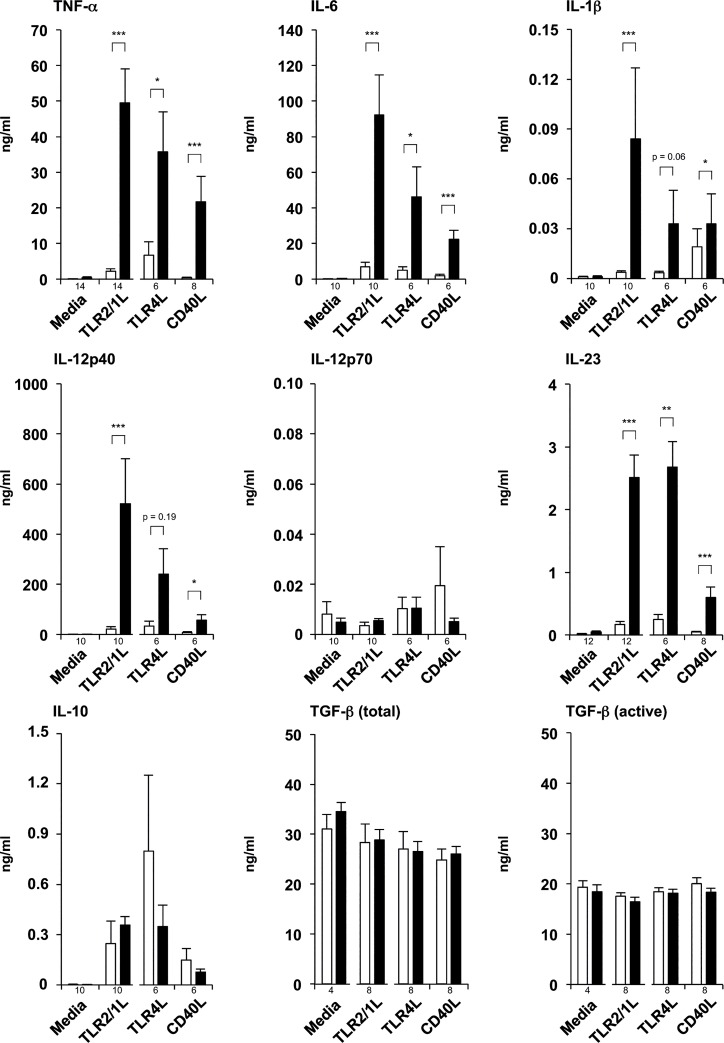
Fig 3. Cytokine profiles of 1,25Ddiff-DCs vs. serum-DCs stimulated with different ligands.
Monocytes were differentiated for six days using rGM-CSF and rIL-4 in media with 10% FCS in the presence (1,25Ddiff-DCs, black bars) or absence (serum-DCs, white bars) of additional 1,25D (10−8 M). Subsequently, 1,25Ddiff-DCs and serum-DCs were stimulated with TLR2/1L (1μg/ml), TLR4L (10 ng/ml) or CD40L (5 μg/ml) or left untreated, and cultured in fresh media with 10% FCS for 18–24 hours. TNF-α, IL-6, IL-1β, IL-12p40, IL-12p70, IL-23 and IL-10, as well as total and active TGF-β levels in culture supernatants were measured by ELISA or CBA (mean cytokine levels in ng/ml ± SEM, n of each condition indicated by numbers under the bars). *p<0.05, **p<0.01, ***p<0.001

