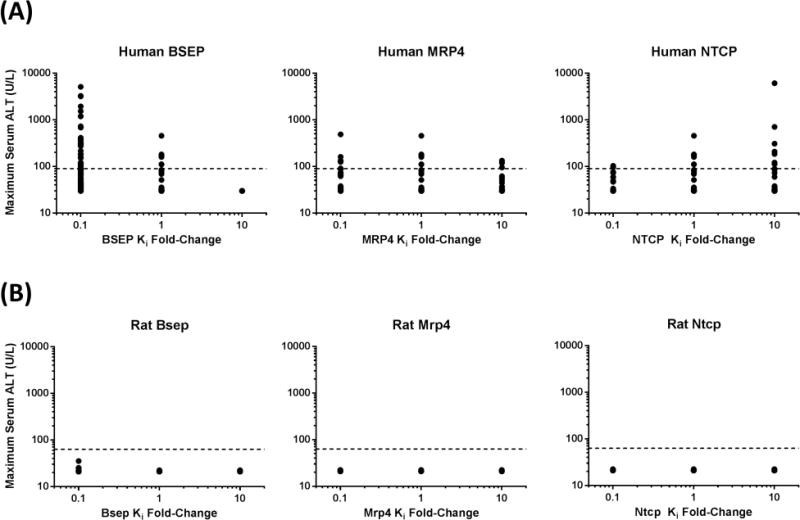
Figure 5. Sensitivity analysis of transporter inhibition constants.

Inhibition constants for BSEP, MRP4, and NTCP were altered 10-fold in either direction of the values measured in isolated transport systems (Supplementary Table S2). Predicted maximum serum ALT concentrations in human and rat SimPops after an oral dose of 600mg/day and 5 mg/kg/day troglitazone (TGZ), respectively, for 1month are presented. Dashed lines represent 3× baseline ALT in human (90 U/L) and rat (63 U/L) SimPops.
