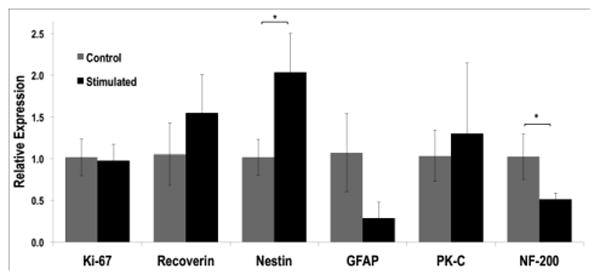
Figure 3. Gene Expression Levels Change with Electrical Stimulation.

Quantitative PCR was used to evaluate relative changes in mRNA levels between stimulated and non-stimulated mRPCs on PPy. *p<0.05, n≥ 3.

Quantitative PCR was used to evaluate relative changes in mRNA levels between stimulated and non-stimulated mRPCs on PPy. *p<0.05, n≥ 3.