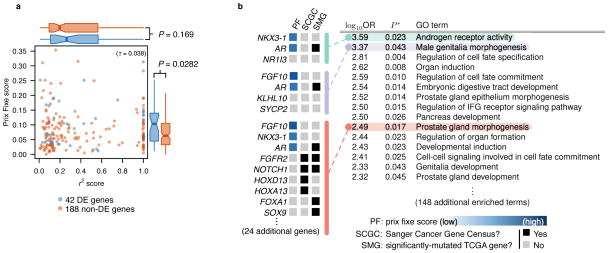
Figure 4.
(a) Prix fixe scores are uncorrelated with LD (r2) values. Each scatter plot point is a candidate breast cancer gene. Correlation is computed using Kendall’s τ rank coefficient. Blue genes indicate significantly differentially-expressed mRNA levels in matched case-control TCGA prostate adenocarcinoma (PRAD) samples, while red genes indicate no evidence of cancer-dependent differential expression. Flanking boxplots indicate score distributions of differentially- and not-differentially-expressed genes. Boxplot whiskers extend to 1.5×IQR; outliers not shown. Boxplots compared by one-sided Wilcoxon rank sum tests. (b) Prix fixe rankings identify disease-relevant Gene Ontology (GO) terms for prostate cancer, with no a priori knowledge of disease etiology. Top-15 (by odds-ratio (OR)) GO terms shown using “ordered” functional enrichment analysis with significance (P*) corrected for multiple testing 29. Three GO terms expanded to show constituent genes with (if available) “PF” score, “SCGC” (Sanger Cancer Gene Census) status, and “SMG” (significantly-mutated gene 35) status. Full functional enrichment analysis for all traits provided in Supplementary File 3.

