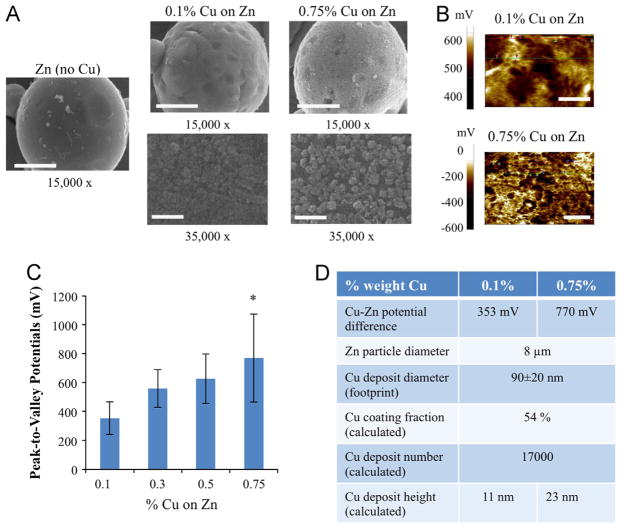
Fig. 1.
Characterization and modeling of galvanic microparticles. (A) Scanning electron microscope (SEM) micrographs of galvanic microparticles of Zn, 0.1% Cu on Zn, and 0.75% Cu on Zn, at 15,000 × and 35,000 × magnification, respectively. Scale bars for micrographs at 15,000 × and 35,000 × magnification correspond to 3 μm, and 1 μm, respectively. (B) Scanning Kelvin probe microscopy (SKPM) images of Zn surface coated by copper specks amounting to 0.1% and 0.75% weight Cu, respectively. Scale bars correspond to 500 nm and 1 μm, respectively. (C) Peak-to-valley potentials calculated via surface potential analysis of SKPM images for a range of Cu coatings (0.1%–0.75% of Cu on Zn). *denotes p-value <0.001 (T-test). (D) Parameters determined from SEM and SKPM data for 0.1% and 0.75% Cu on Zn, respectively.

