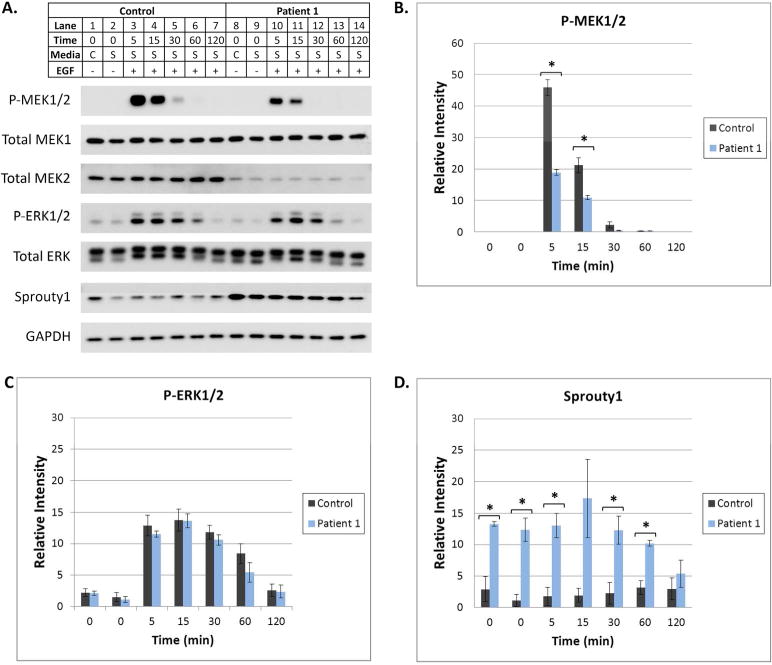
Figure 3. Regulation of the Ras/MAPK Pathway is altered when MEK2 is deleted.

(A) At subconfluency, fibroblasts were placed in complete (C, 10% FBS) or serum starvation (S, 0.1% FBS) media for 16 hours. Serum starved cells were then treated with EGF for 5–120 min. Cells were harvested and protein lysates were subjected to Western blot analysis utilizing antibodies specific for various MAPK pathway components. A representative Western blot is shown. GAPDH was utilized as a loading control. Differences in the levels of P-MEK1/2, P-ERK1/2, Total MEK2, and Sprouty1 were observed as described in the Results. (B, C, and D) Image J software was used to quantify P-MEK1/2, P-ERK1/2, and Sprouty 1 bands on Western blots from 3 separate experiments. Error bars represent standard error of the mean relative intensity calculated for 3 experiments. Asterisks indicate p-values <0.05 for the control compared to patient 1. Statistically significant differences in P-MEK1/2 and Sprouty1 were observed.
