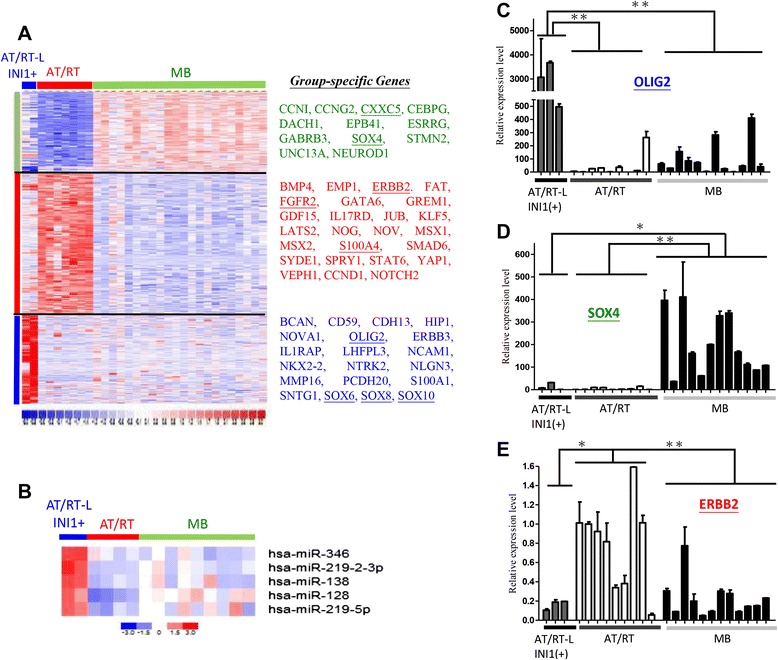
Fig. 3.

Genes that distinguish AT/RTs, MBs, and INI1(+) AT/RT-like tumors. (a-b) Heat maps show group-specific genes (a) and microRNAs (b). AT/RT-L: AT/RT-like. Red: up-regulation, Blue: down-regulation. (c-e) Real-time PCR validation of OLIG2 (c), SOX4 (D) and ERBB2 (e) array data on new batches of patient RNAs. * P < 0.05; ** P < 0.01
