
Fig. 2.
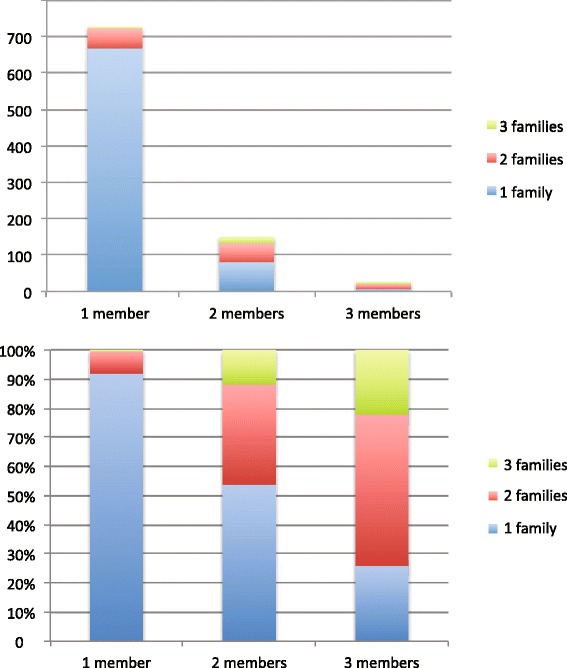
Sharing of resistance-associated proteins within and between families. The top graph shows absolute counts of resistance-associated protein clusters, grouped by the number of members within a given family they were identified in. Most protein clusters were only identified in one member of one family; much smaller numbers were identified in multiple family members or multiple families. The lower graph shows the proportions of resistance-associated protein clusters identified in multiple families, grouped by the number of members of a single family they were identified in. Larger proportions of resistance-associated proteins that are shared are multiple members of a single family are also identified in multiple unrelated families