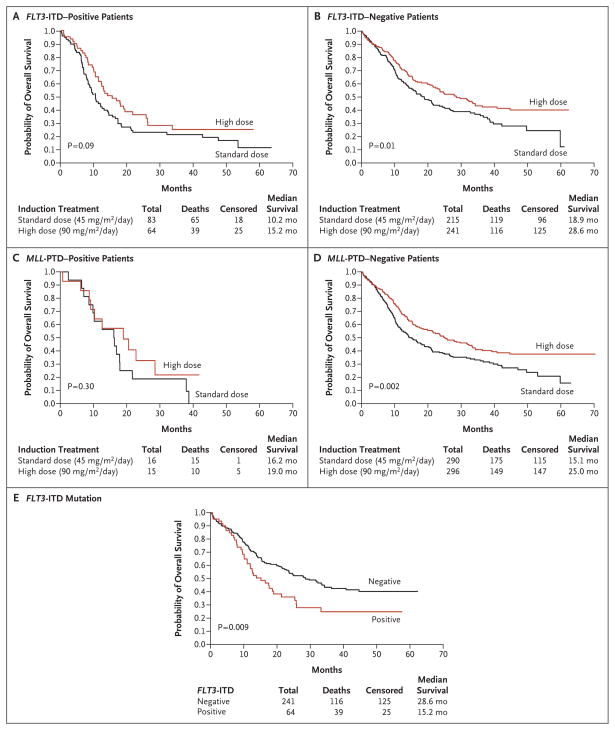
Figure 3. Kaplan–Meier Estimates of Overall Survival, According to Mutation Status.
Data are shown for the overall survival of patients with the FLT3-ITD mutation (Panel A), those without the FLT3-ITD mutation (Panel B), those with the MLL-PTD mutation (Panel C), and those without the MLL-PTD mutation (Panel D). Also shown are survival curves for patients who received high-dose daunorubicin (90 mg per square meter of body-surface area per day), according to the presence or absence of the FLT3-ITD genotype (Panel E). ITD denotes internal tandem duplication, and PTD partial tandem duplication.

