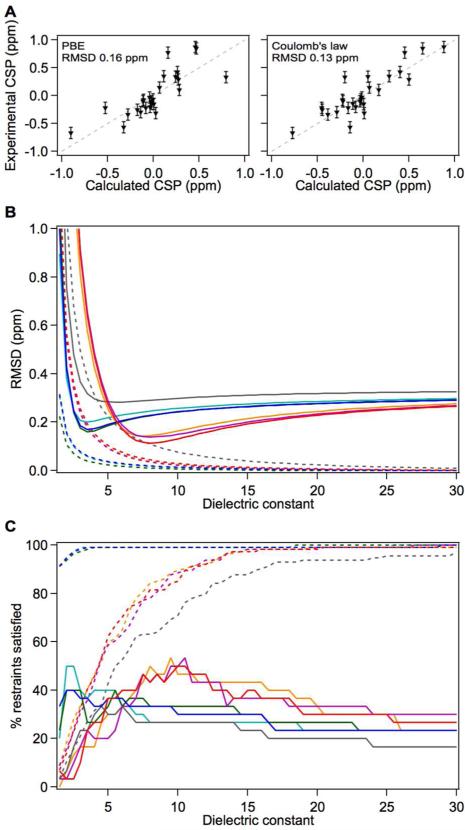
Figure 3.
Optimal values of εp and εeff using 15N CSPs measured in ACBP. (A) Correlation between experimentally measured 15N Δδef emanating from the His30 charge and calculated 15N Δδef obtained from the static structure PDB ID: 1HB6 and with optimal dielectric constant values that minimize RMSD (εp=3.5; εeff=7.5). (B) Average RMSD between measured and predicted 15N Δδef in ACBP as a function of dielectric constant. Solid lines depict the RMSD of observed Δδef and dashed lines depict the RMSD of absent Δδef. Color scheme: calculations with static structure with PBE (cyan) or with Coulomb's law (orange), calculations with an ensemble of static structures using PBE (blue) or Coulomb's law (red), calculations with an ensemble generated with MD simulations and PBE (green) or Coulomb's law (magenta), microscopic approach (grey). (C) Fraction of 15N reporter nuclei whose predicted Δδef are within the nucleus-specific experimental errors of the observed Δδef (solid line) and absent Δδef (dashed line). Color scheme is identical to (B).

