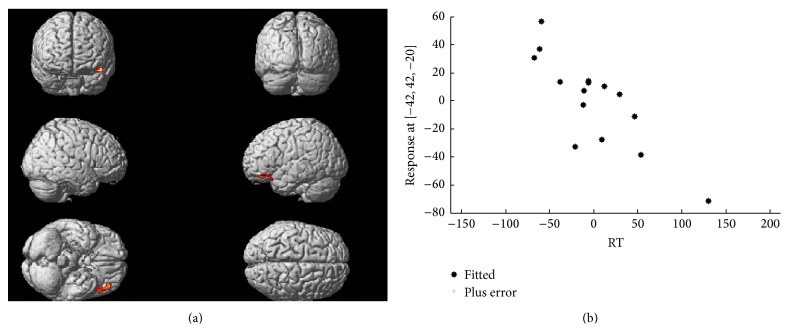
Figure 2.
Correlation between 18F-DOPA uptake and reaction time. The upper panel shows whole brain voxel-wise correlation analysis depicting (superimposed to a brain rendering) the sites of significant inverse correlation between reaction time and PET-assessed dopaminergic activity. The cluster includes areas pertaining to the middle and inferior frontal as well as the superior temporal gyri in the left hemisphere. The lower panel shows the plot as automatically generated by SPM expressing the correlation between the two variables after transformation of the native values around 0.

