
Fig 2. Heatmap and hierarchical clustering of significantly different metabolites stratified by ACTN3 RR vs XX genotype.
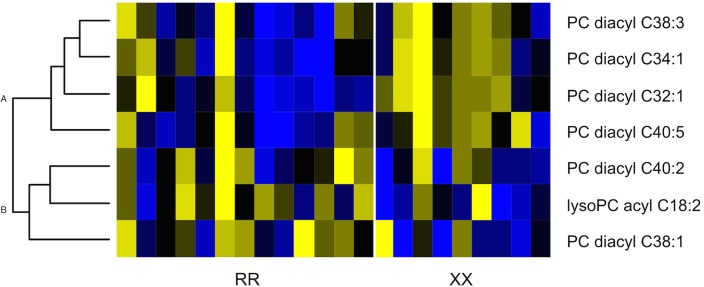
Yellow blocks represent high concentrations; blue blocks represent low concentrations; black blocks represent medium concentrations.