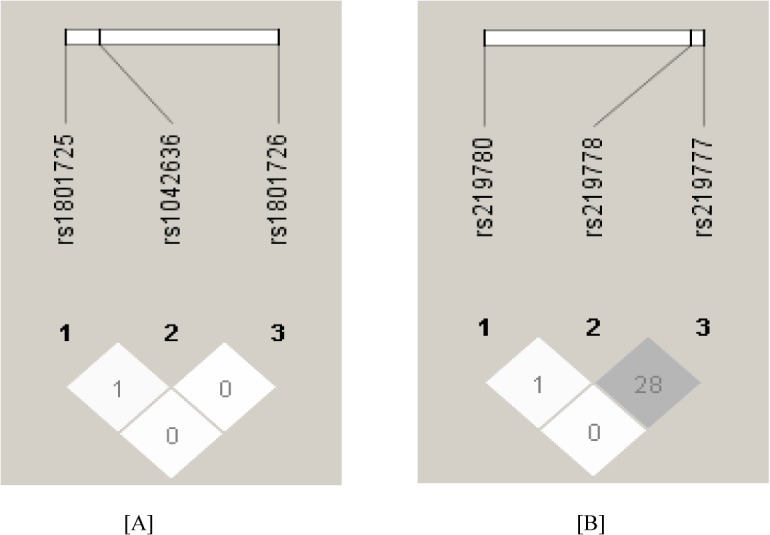
Fig 1. [A] & 1[B] Linkage disequilibrium (LD) pattern (r2) of the three SNPs in CaSR gene and three SNPs in CLDN14 gene respectively in case and control groups.

The LD between the SNPs is measured as r2 and shown in the diamond at the intersection of the diagonals from each SNP. r2 = 0 is shown as white, 0 < r2 <1 is shown in gray and r2 = 1 is shown in black.
