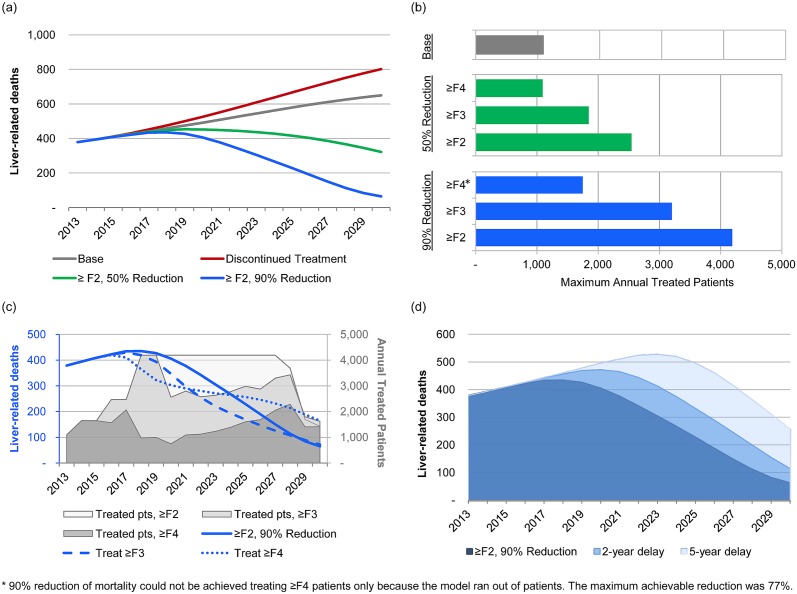
Fig 3. Exploratory scenario outputs, 2013–2030.
(A) HCV-related liver-related deaths, by scenario; (B) Maximum number of patients treated annually to achieve 50% or 90% reduction, by METAVIR stage treated; (C) Impact of treatment restrictions (restriction to ≥F3 or F4) on a strategy to reduce liver-related mortality by 90%, and the annual number of patients treated before ‘running out of patients’; (D) Impact of 2-year and 5-year delays on a strategy to reduce liver-related mortality by 90%.

