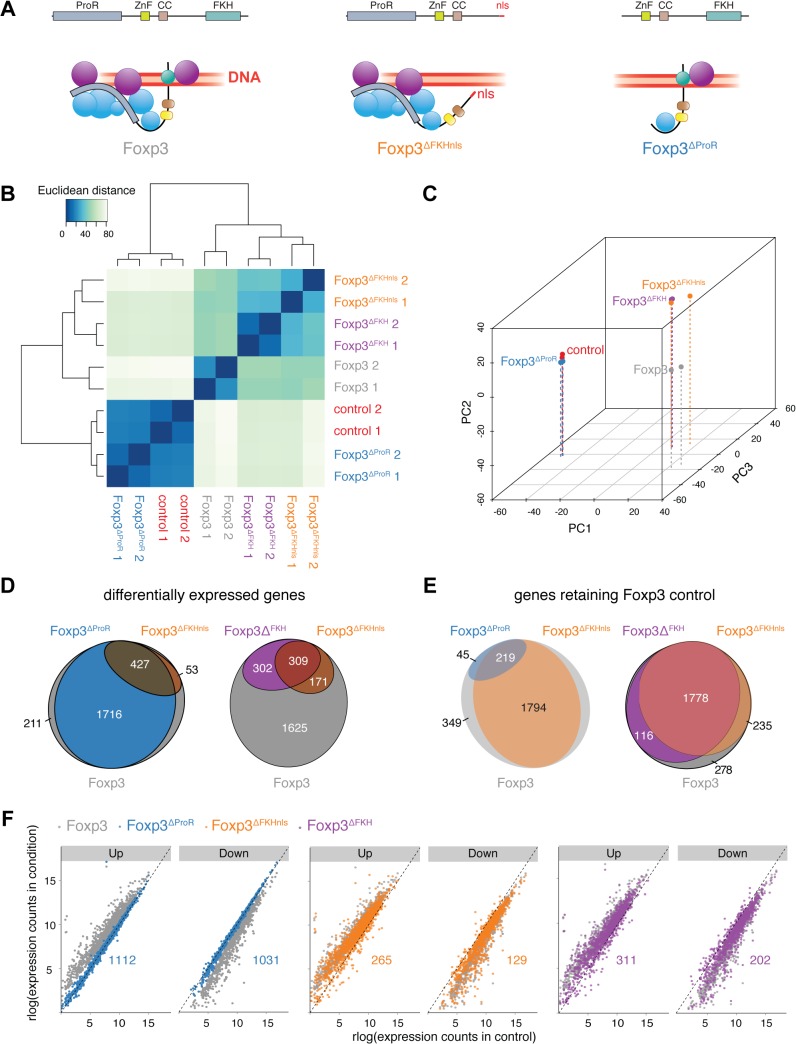
Fig 1. Separation of FKH-mediated DNA binding from the scaffolding function of Foxp3.
(A) Model of complex formation and DNA binding of wild type, FKH deletion mutant with an SV40 NLS sequence (Foxp3ΔFKHnls) and proline-rich region (exon 1 to exon 3) deletion mutant (Foxp3ΔProR) of Foxp3. Spheres represent putative Foxp3 interaction partners with (purple) or without (blue) their own DNA binding capability. (B) Quantification of the similarity in the gene expression profiles of naïve TH cells transduced with expression vectors for wild type (Foxp3), GFP (control) or mutant Foxp3 genes: Foxp3ΔFKHnls, Foxp3ΔFKH, Foxp3ΔProR. Transcriptomes from two independent experiments are shown. Euclidean distances were calculated from regularized log-transformed read counts for Foxp3-regulated genes. (C) Principal-component analysis of the transcriptomes calculated from gene expression data using regularized log-transformed read counts. Color spheres represent individual experiments. PC1, PC2 and PC3 account for 55.4%, 21.1% and 7.22% of the variance, respectively. PC values were calculated using all samples used in this study, but only the samples relevant to this figure are shown here. (D) Venn diagrams showing sets of Foxp3-regulated genes which are differentially expressed (adjusted P< 0.05) in a comparison between TH::Foxp3 cells and those transduced with other constructs. The set of all Foxp3-regulated genes is represented by a grey ellipse, while colored ellipses represent sets of differentially expressed genes. (E) Venn diagrams showing sets of Foxp3-regulated genes that retain their Foxp3-like control in cells transduced with the indicated constructs. The set of all Foxp3-regulated genes is represented by a grey ellipse, while colored ellipses represent sets of genes retaining Foxp3-like control. (F) Comparison of Foxp3-regulated gene expression in TH::control cells and those transduced with other constructs. Each dot represents an individual Foxp3-regulated gene. Genes are separated into those shown to be upregulated by Foxp3 expression and those that are downregulated. Differential gene expression was calculated from the two independent experiments using Wald tests on moderated log2 fold changes as implemented by the DESeq2 R package with P values adjusted for multiple testing using the procedure of Benjamini and Hochberg [58]. Numeric annotations on the graphs indicate the number of Foxp3-upregulated and Foxp3-downregulated genes that are dysregulated by each mutant.

