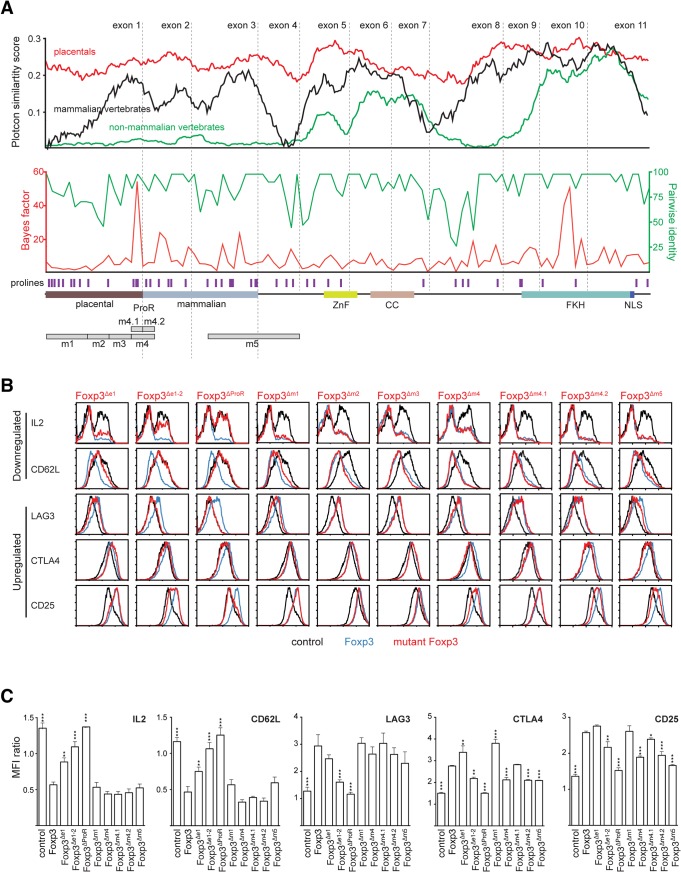
Fig 3. Mutational dissection of ProR of Foxp3 reveals distinct mechanisms of gene regulation.
(A) Conservation plot (top) showing the average similarity score at individual amino acid positions from multiple sequence alignments of placental mammalian Foxp3 (red; seven species), non-placental mammalian Foxp3 (black; three species) and non-mammalian vertebrate Foxp3L (green; seven species). The ‘placental’ and ‘mammalian’ halves of the ProR were defined semi-arbitrarily based on the homology across different species. The plots were generated using EMBOSS plotcon with a window size of 20. The REL test as implemented in Datamonkey was used to perform a sliding window analysis (4 codons) of placental Foxp3s with calculated Bayes factors plotted in red (bottom). The average pairwise identity (averaged over 4 amino acids) between Foxp3s is plotted in green (dotted grey lines: exon boundaries). The positions of proline residues are denoted by purple bars. For orientation, a schematic representation of Foxp3 is shown at the bottom. m1-m5 denote regions of interest for which deletion mutants were generated. (B) Flow cytometry analysis of Foxp3 target gene expression in TH cells transduced with wild type Foxp3 (blue), control vector (black) and Foxp3 mutants (red). Foxp3Δe1: deletion of exon1; Foxp3Δe1-2: deletion of exon 1–2, Foxp3ΔProR: deletion of exon 1–3; Foxp3Δm1: deletion of region m1; Foxp3Δm2, Foxp3Δm3, Foxp3Δm4, Foxp3Δm5: regions m1, m2, m3, m4, m5 were replaced by short stretches of alanines. Foxp3Δm4.1 and Foxp3Δm4.2 are outlined in S2A Fig. Expression was measured in transduced cells rested 48 h post-transduction (plots were gated on rCD8a+ transduced cells and are representative of three independently transduced cell samples in parallel). For IL-2, resting cells were re-stimulated for 12 h with cell stimulation cocktail (PMA and ionomycin with protein transport inhibitor) before staining. (C) Summaries of normalized mean fluorescence intensity (MFI) in (B), shown as ratios of MFI (mean ± SD) of rCD8a+ cells/ rCD8a- cells in each sample. Significant differences between TH::Foxp3 and cells transduced with the other constructs were determined by one way analysis of variance (ANOVA) followed by Tukey’s post-hoc test(* indicates P≤0.05; ** indicates P≤0.01; *** indicates P≤0.001).

