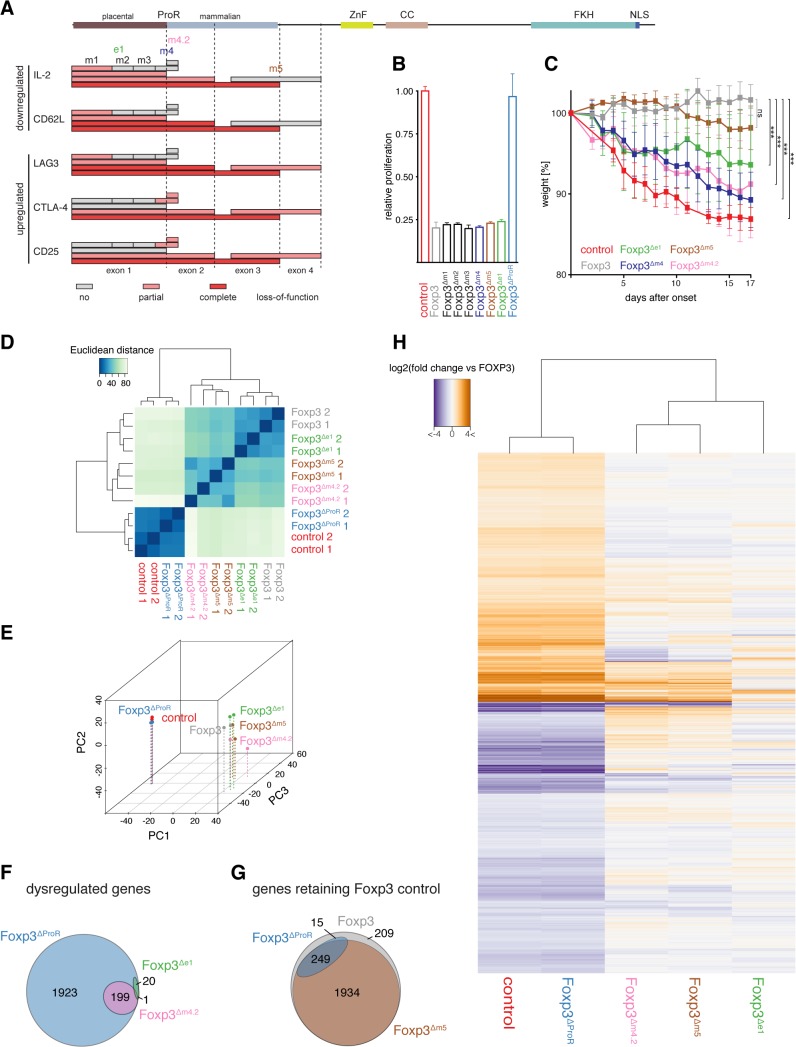
Fig 4. Mutational dissection of ProR of Foxp3 reveals distinct transcriptional programs.
(A) A representation of the Foxp3 mutants’ effects on the expression of target genes measured by flow cytometry. Each box maps the region that has been deleted/replaced by stretches of alanines with the fill in color denoting the effect on the examined gene. (grey: no loss of function; light red: partial loss of gene regulation; red: complete loss of gene regulation) A representation of the full length Foxp3 is shown above with the dotted lines marking the exon boundaries. (B) Suppressive activity of Foxp3 or Foxp3 mutant transduced cells were normalized to that of control transduced cells, which were measured as the relative proliferation of co-cultured 'target' CD4+CD25- TH cells. Data are shown as means ± SD of three independent experiments. (C) FACS sorted CD4+CD25-CD45RBhi TH cells were co-transferred with empty vector (control), Foxp3 or Foxp3 mutant transduced CD4+CD25- TH cells into weight-matched female C.B.-17 SCID mice. The mean weight of the mice (n≥5 mice per group) was set to 100% the day before the control mice started to lose weight. Each symbol represents the mean weight ± SEM value for each group on each measurement day. P values were determined by one-way ANOVA (ns: not significant, *** P≤0.001). (D) Quantification of the similarity in gene expression profiles of TH cells transduced with wild type (Foxp3), GFP (control), Foxp3ΔProR, Foxp3Δe1, Foxp3Δm4.2 or Foxp3Δm5. Transcriptomes from two independent experiments are shown. Euclidean distances were calculated from regularized log-transformed read counts for Foxp3-regulated genes. (E) Principal-component analysis of the transcriptomes calculated from gene expression data using regularized log-transformed read counts for each Foxp3-regulated gene. Color spheres represent individual experiments. PC1, PC2 and PC3 account for 55.4%, 21.1% and 7.22% of the variance, respectively. PC values were calculated using all samples used in this study, but only the samples relevant to this figure are shown here. (F) Venn diagram showing sets of Foxp3-regulated genes that retain their Foxp3-like control in cells transduced with the indicated constructs. The set of all Foxp3-regulated genes is represented by a grey ellipse while the blue ellipse indicates the set of genes that retain their regulation in TH::Foxp3ΔProR and the brown ellipse those genes that retain their regulation in TH::Foxp3Δm5. (G) Venn diagram showing the set of all Foxp3-regulated genes dysregulated by deletion of the ProR (TH::Foxp3ΔProR; blue ellipse). The pink ellipse represents those genes that are dysregulated in TH::Foxp3Δm4.2 and the green ellipse those dysregulated in TH::Foxp3Δe1. (H) Heat-map of log-transformed fold-changes in expression of Foxp3-regulated genes between TH::Foxp3 cells and cells transduced with the various Foxp3 mutants. The dendrogram above the plot indicates hierarchical clustering performed using Euclidean distance. Differential gene expression in (F), and (G) was calculated from the two independent transduction experiments shown in (D) and (E) using Wald tests on moderated log2 fold changes as implemented by the DESeq2 R package with P values adjusted for multiple testing using the procedure of Benjamini and Hochberg [59].

