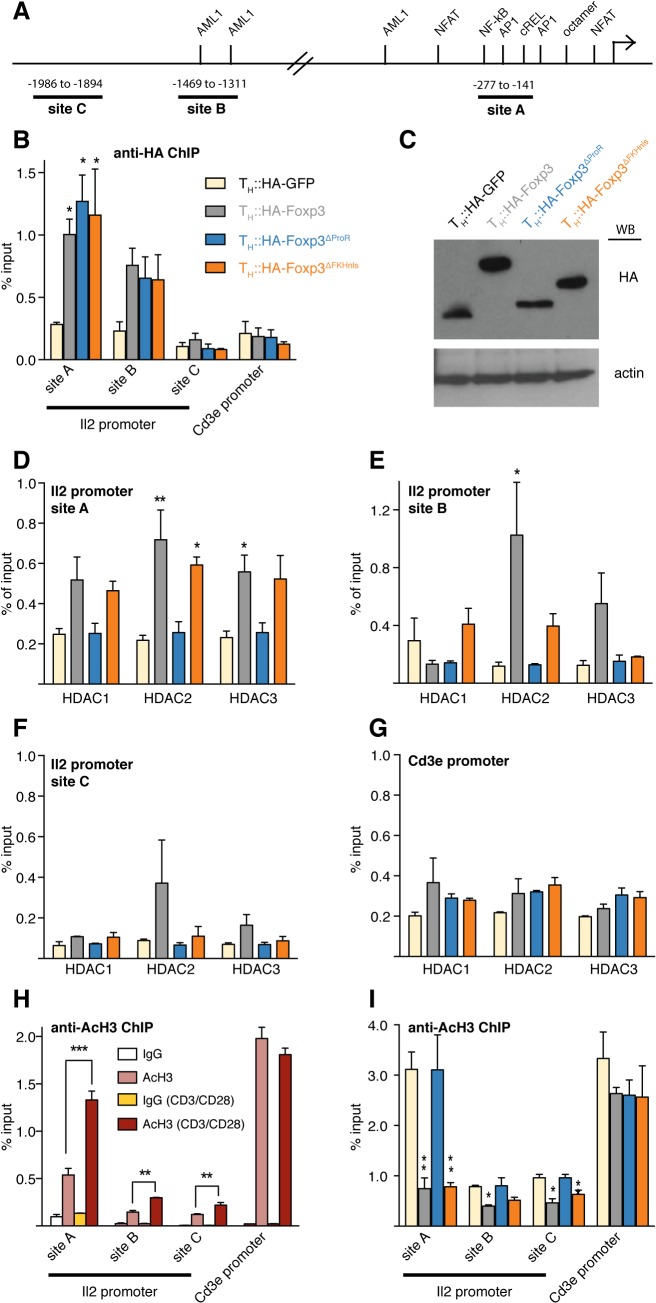
Fig 7. Foxp3 recruits class I HDACs to modulate histone acetylation of the Il2 promoter.
(A) Schematic diagram showing binding sites of well-known transcription factors regulating the Il2 promoter [19] and the regions analysed in (B to I). (B) Primary TH cells were transduced with retrovirus carrying HA-Foxp3, HA-GFP and HA-tagged Foxp3 deletion mutants. Transduced cells were rested and re-activated by CD3/CD28 for 6 h. ChIP quantitative PCR (qPCR) was used to analyze the binding of HA-GFP, HA-Foxp3 and deletion mutants at the Il2 promoter using anti-HA antibody. Cd3ε promoter was used as negative control. (C) Expression of the respective HA-tagged proteins. Western blot is representative of two independent experiments. (D to G) ChIP-qPCR analysis of the binding of Class I HDACs at different Il2 promoter sites and Cd3e promoter in re-activated transduced TH cells expressing HA-tagged GFP, Foxp3 or the respective deletion mutant—color code as in (B). (H) ChIP-qPCR analysis of Il2 promoter and Cd3e promoter using anti-acetylated histone 3 antibody in primary TH cells, with (dark red) or without (light red) CD3/CD28 activation. Normal rabbit IgG was used as control (white and yellow). (I) ChIP-qPCR analysis of Il2 and Cd3e promoter in re-activated transduced TH cells expressing HA-tagged GFP, Foxp3 or the respective deletion mutant using anti-acetylated histone 3 antibody—color code as in (B). Height of bars represent mean values ± SD. P values between TH::HA-GFP and TH::HA-Foxp3 or the respective Foxp3 mutant transduced cells were determined by one-way ANOVA followed by Tukey’s post-hoc test. P values in (H) between rested and activated TH cells were determined by an unpaired, two-tailed t-test (* indicates P<0.05; ** indicates P<0.01; ***indicates P<0.001). In all cases, data are representative of three independent experiments for each construct.

