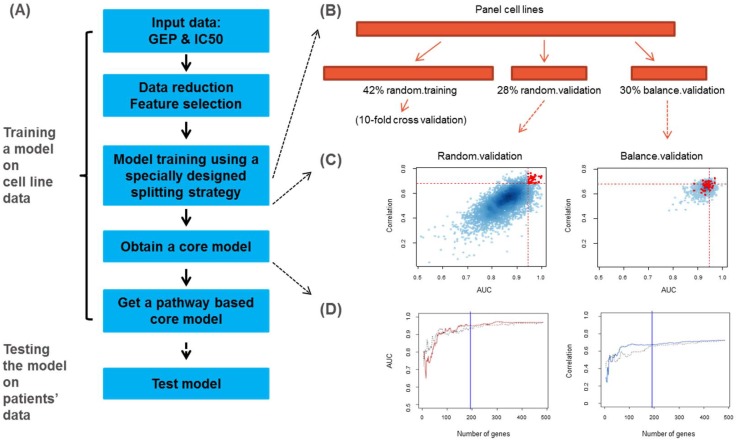
Fig 1. PLSR modeling workflow applied on 183 cancer cell lines on OncoPanel.
(A). Flow chart on the model building and testing steps. (B). A specially designed splitting strategy divides the training dataset into random training, random validation and balance validation subsets. (C). Representative example of random validation and balance validation. Red points were top performing models on 1000 random splits on this balanced split, based on both AUC and correlation measures. (D). AUC and correlation cutoff selection for the core PLSR model.

