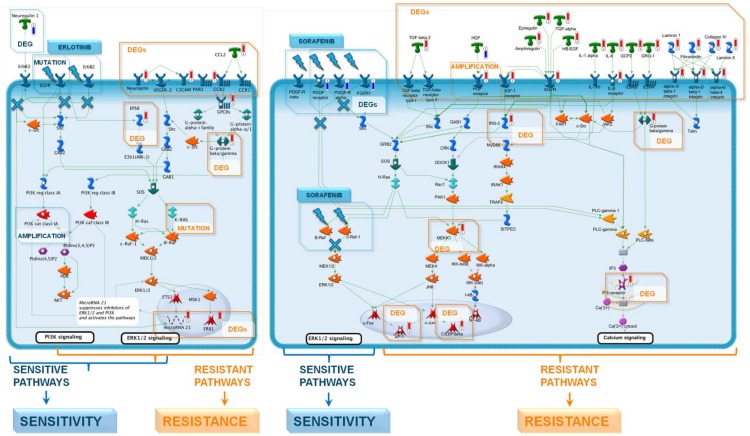
Fig 2. Causal network to depict functional relations between sensitivity-specific and resistance-specific signature genes.
The network was reconstructed from canonical signaling pathways regulated by signature genes and a signature specific direct interaction network. Sensitivity-specific signature genes are highlighted with blue thermometers, resistance-specific genes with red thermometers.

