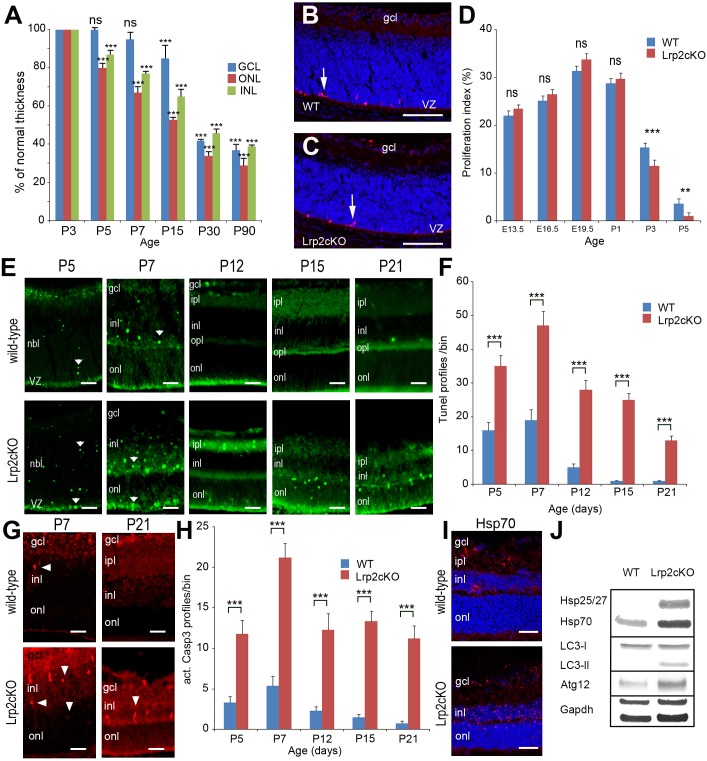
Fig 5. Decreased retinal cell density is associated with increased cell death in Lrp2 FoxG1.cre-KO mutant eyes.
Reduced retinal cell density in the ONL, INL and GCL between P5 and P90. Values are expressed in % of normal thickness of the corresponding layers. Comparisons were calculated between P3 as 100% cell density and the other time points in each layer. Two-way ANOVA post hoc Tukey was used, ***P<0.001, ns: non statistically significant, n = 5 animals per age. (A). The PH3 + cells are similarly distributed in control (B) and mutant retinal layers at P3 (C). Similar proliferation indexes in control and mutant retinas between E13.5 and P1, a significant reduction is seen in the mutants at P3 and P5 (D). In normal retinas TUNEL + cells are essentially seen in the INL and to a lesser extent in the ONL and GCL layers (E, upper panel). In the mutants the TUNEL signal appears stronger in the INL, ONL and IPL (E, lower panel). Cell death is significantly increased in the mutants between P5 and P21 (F). Distribution of caspase 3+ apoptotic cells in control and mutant retinas at P7 and P21 (G). Apoptosis is significantly increased in the mutants (H). The expression of the marker of autophagy Hsp70 is particularly strong in the mutant INL (I). Western-blot analysis of the indicated autophagic markers; GAPDH is used as an internal loading control (J). Two-way ANOVA post hoc Tukey test was used, **P<0.01, ***P<0.001, ns: not statistically significant, values are mean ± SEM of 5 animals per age and genotype; ***p<0.01. Scale bars: 50 μm in B, C, I; 30 μm in E, G.

