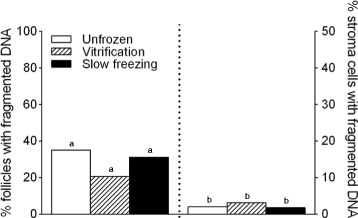
Fig. 3.

DNA fragmentation in follicles. Histograms presenting proportion of TUNEL-positive follicles (left panel) and stroma cells per high power field before (white plots) and after cryopreservation using vitrification (black hatched plots) versus slow freezing methods (black plots) (n = 5 patients). Pairwise comparisons between unfrozen, vitrification and slow-freezing groups were performed using a Tukey-Kramer test. a,b No difference among the three groups (a p > 0.05, b p > 0.05)
