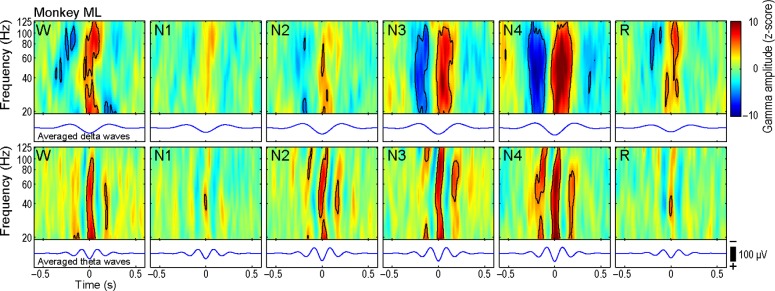
Figure 3.

Phase-amplitude cross-frequency coupling (CFC). The mean normalized gamma amplitudes aligned to the trough of delta/theta oscillation. Black contour lines represent the significance threshold at P < 0.05 after Bonferroni correction. The most prominent CFC was observed during stage N4.
