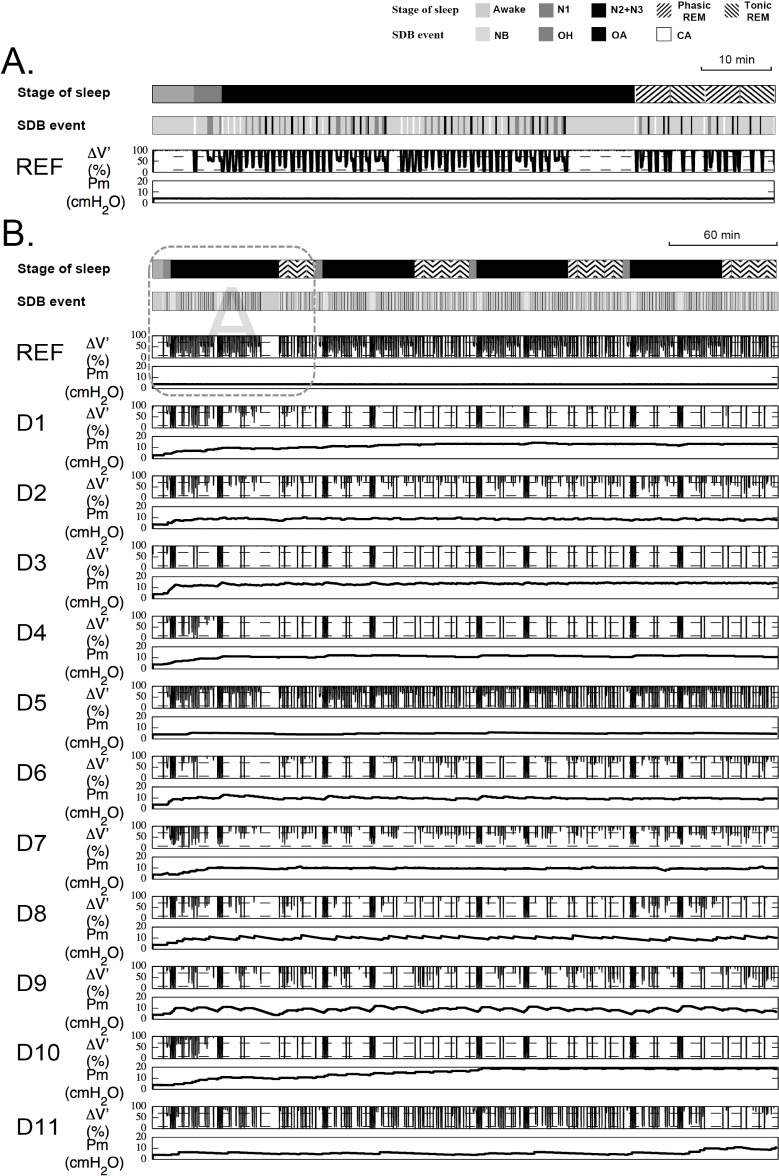
Figure 5. Illustration of the general scenarios and results.
(A) Short general scenario, which corresponded to the first sleep cycle in the long general scenario (the framed part in B). (B) long general scenario with 4 sleep cycles. In both two panels, the simulated stages of sleep are shown in the first line. The SDB events and the scenario are indicated in the second line, in which the bars indicate corresponding SDB events. The width of bars is proportional to the duration of the event. The dashed lines in the ΔV' panels represent 10% and 70% of baseline flow amplitude. Of note, snoring, cardiac oscillations and “obstructive pressure peak” signal were not simulated in either scenario. NB, normal breathing; OH, obstructive hypopnea; OA, obstructive apnea; CA, central apnea; ΔV', airflow amplitude, expressed in percentage of the amplitude of normal breathing airflow; Pm, mask pressure; REF, the resultant flow amplitude and mask pressure of the reference test, which was carried out with a constant positive pressure = 4 cm H2O; D1, iCH Auto; D2, RESmart Auto; D3, iSleep20i; D4, Floton Auto; D5, SleepCube Auto; D6, ICON+; D7, PR1 Remstar Auto; D8, S9 AutoSet; D9, DreamStar Auto; D10, Transcend Auto; D11, SOMNOBalance-e. All devices decreased their pressure after a 10-min normal breathing session except D3. D9 decreased its pressure most rapidly during the 10-min normal breathing session.

