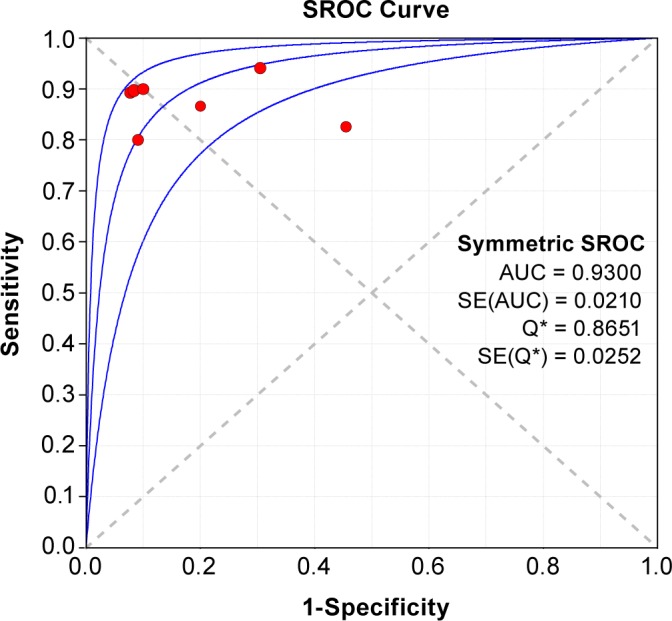
Figure 3. Summary receiver operating characteristic (SROC) curves for acoustic analysis of snoring in the diagnosis of obstructive sleep apnea.

Each circle represents each of the seven studies included in the meta-analysis. The size of each study is indicated by the size of the solid circle. The regression SROC curve summarizes the overall diagnostic accuracy. AUC, area under the curve; SE, sleep efficiency.
