
Figure 2.
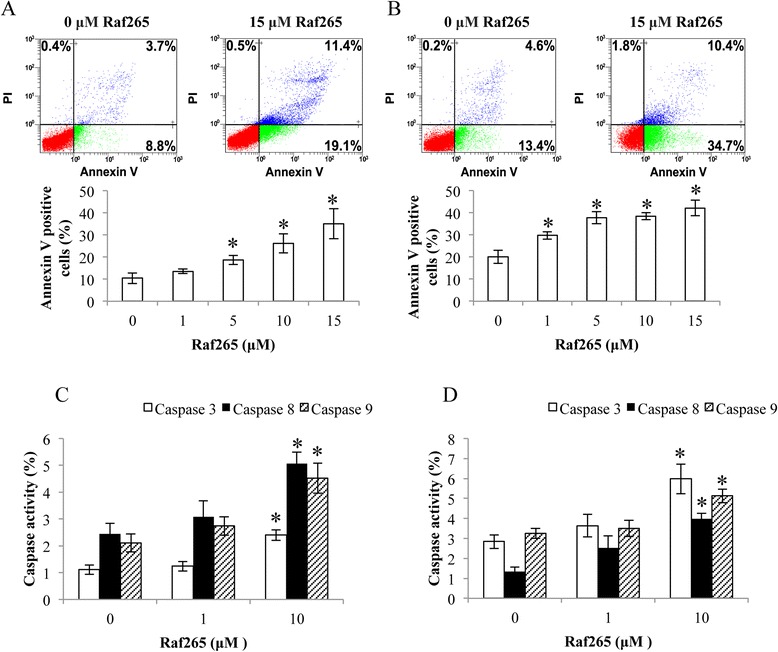
The apoptotic effect of Raf265 on HT29 and HCT116 cells. A. HT29 cells and B. HCT116 cells were treated with 0–15 μM Raf265 and Annexin V assay was performed. Representing flow diagrams at 0 and 15 μM were shown at the upper panel and bar charts presenting the average percentage of annexin V positive cells after treatment were shown at the lower panel. C. HT29 cells and D. HCT116 cells were treated with 0–10 μM Raf265. Caspase 3, caspase 8 and caspase 9 activities were analyzed by flow cytometry. Data are presented as means ± SD from three independent experiments and statistical analysis was performed by one-way ANOVA. *p < 0.05 versus untreated control.