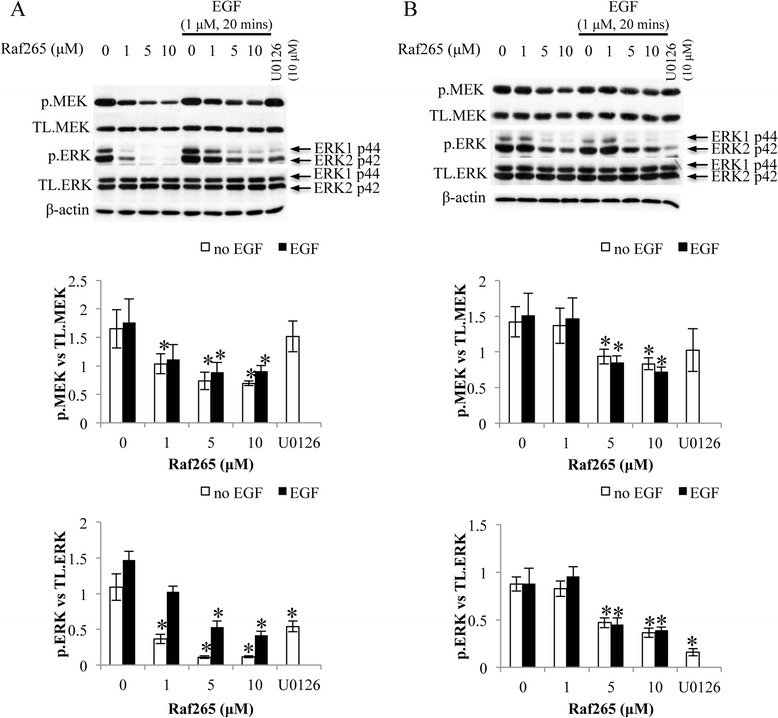
Figure 3.

Inactivation of the Raf/MEK/ERK signaling pathway by Raf265 on HT29 and HCT116 cells. A. HT29 cells and B. HCT116 cells were treated with 0–10 μM Raf265 with or without the addition of EGF, or 10 μM U0126. Representing blots of the western blot analysis of the total expression and phosphorylation of MEK and ERK were shown. The expression level of β-actin was used as the loading control. At the lower panels, bar charts presenting the ratio of p.MEK vs. TL. MEK and p.ERK vs TL. ERK were shown. Data are presented as means ± SD from three independent experiments and statistical analysis was performed by one-way ANOVA. *p < 0.05 versus untreated control of the corresponding cell lines.
