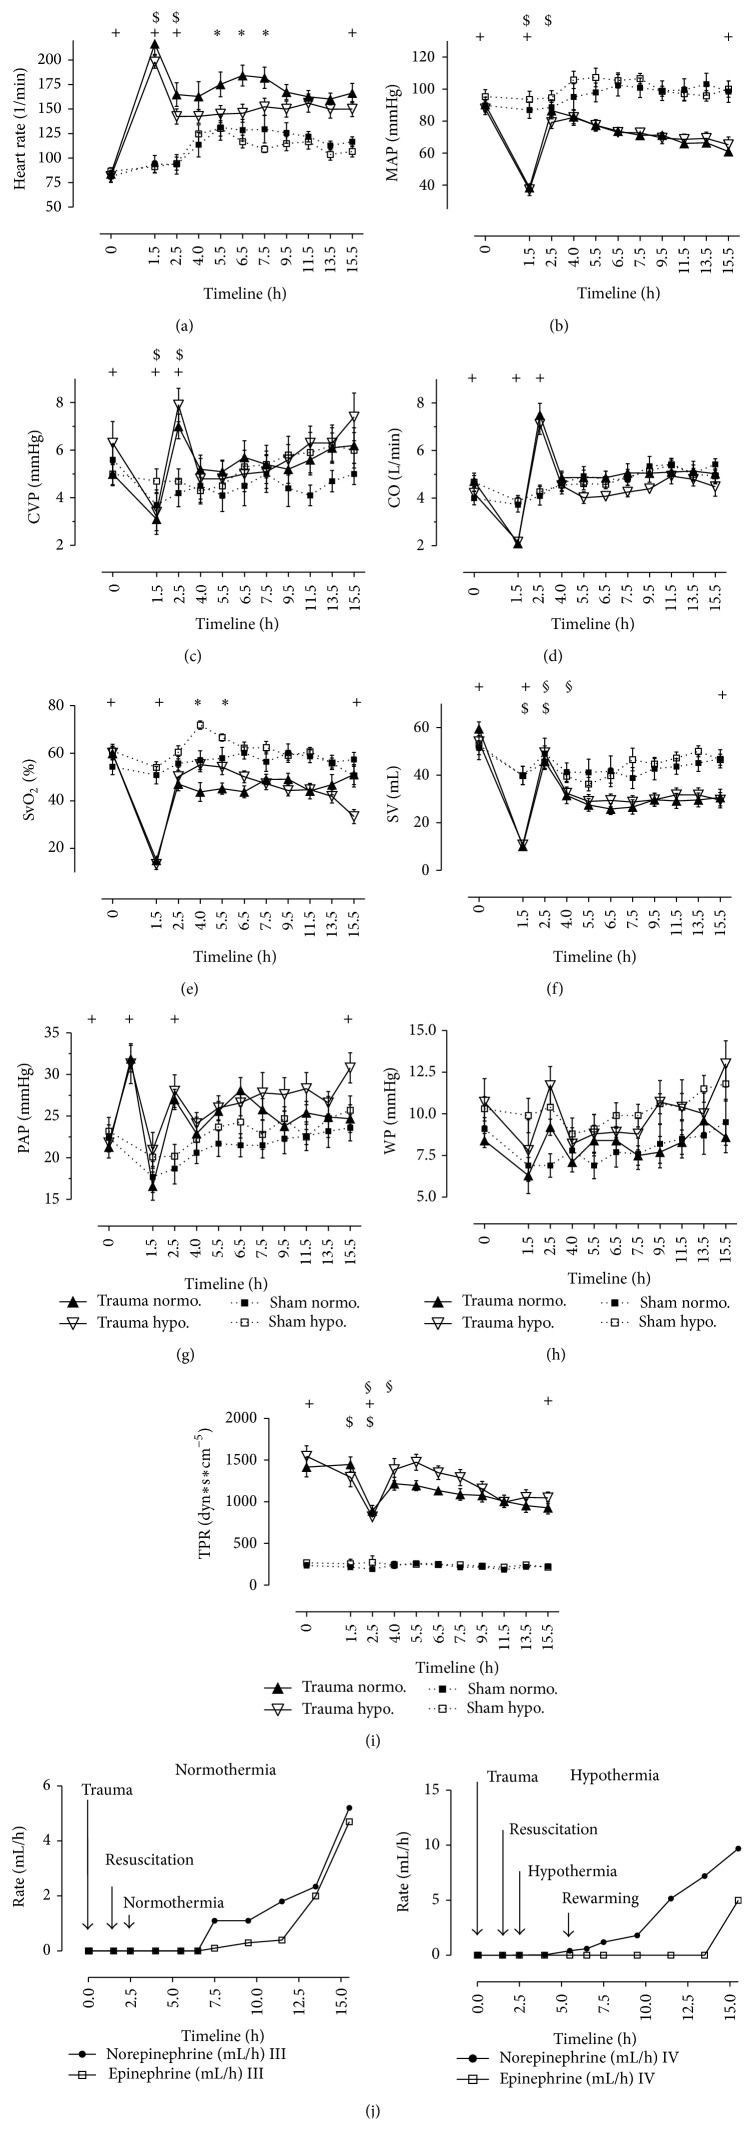
Figure 2.
Normothermic and hypothermic sham animals versus normothermic and hypothermic trauma animals. N = 40. Timeline 15.5 hrs. Data are shown in mean and standard error of mean. + P < 0.05, values at BL versus values at S and at R and values at E of trauma pigs (0, 1.5, 2.5, and 15.5 hrs). ∗ P < 0.05, normothermic versus hypothermic pigs during cooling phase (4, 5.5 hrs). $ P < 0.05, values at S versus values at R in trauma pigs (1.5 and 2.5 hrs). § P < 0.05, values at R versus values at H in trauma pigs (2.5 and 4.0 hrs). (a) Heart rate (HR in 1/min). (b) Mean arterial pressure (MAP in mmHg). (c) Central venous pressure (CVP in mmHg). (d) Cardiac output (CO in l/min). (e) Mixed venous oxygen saturation (SvO2 in %). (f) Stroke volume (SV in mL). (g) Pulmonary artery pressure (PAP in mmHg). (h) Wedge pressure (WP in mmHg). (i) TPR (dyn ∗ sec ∗ cm−5). (j) Norepinephrine and epinephrine in 3 mg/50 mL (in mL/h).

