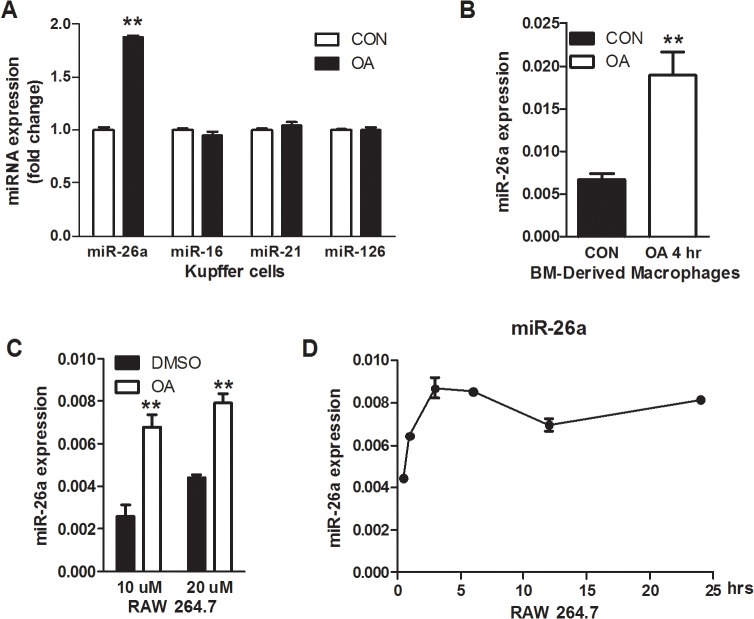
Fig 4. TGR5 activation induced miR-26a expression in macrophages.
(A, B) Expression of indicated miRNAs in Kupffer cells (A) and bone marrow-derived macrophages (B) treated with OA (10 μM) for 24h. (C, D) Expression of miR-26a in RAW264.7 cells, a mouse macrophage cell line, treated with OA as indicated with different dose (C) or different time points (D) (OA, 10 μM). CON: vehicle control; OA: oleanolic acid. ** p<0.01.

