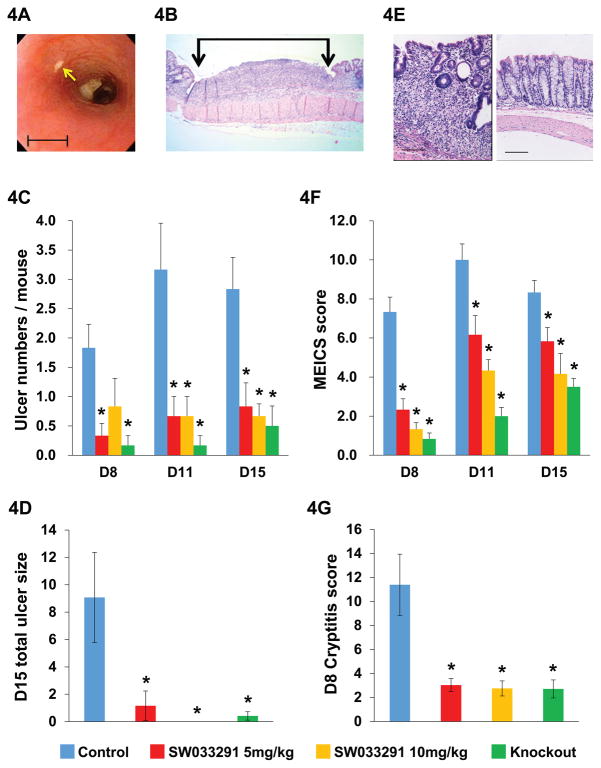
Fig. 4. 15-PGDH inhibition protects mice from DSS-induced colitis.
(A) Colonoscopic view of a DSS-induced colon ulcer (arrow). Scale bar=1 mm. (B) Microscopic image of a DSS induced colon ulcer (between vertical arrows) Scale bar=2.3 mm. (C, D, F, G) Effects of administering 7 days of DSS compared between experimental groups of: vehicle-control-treated mice (blue), SW033291-treated mice (5mg/kg IP twice daily) (red), SW033291-treated mice (10mg/kg IP twice daily) (gold), and 15-PGDH knockout mice (green). (C) Graph of mean number of colon ulcers per DSS treated mouse counted by colonoscopy on study days 8, 11 and 15 (D8, D11, D15) for: vehicle-control-treated mice, SW033291-treated mice (5 mg/kg IP twice daily), SW033291-treated mice (10 mg/kg IP twice daily), and 15-PGDH knockout mice. N=6 mice for each data point. Anova P<10−6. * indicates P<0.016 in daily subgroup comparisons to vehicle-control-treated mice, Student’s t-test. (D) Graph depicts percentage of total colon length covered by ulcers on study day 15, determined by histomorphometric assessment (as in (B)) for DSS treated mice in cohorts of: vehicle-control-treated mice (N=7), SW033291-treated mice (5 mg/kg IP twice daily) (N=8), SW033291-treated mice (10 mg/kg IP twice daily) (N=8), and 15-PGDH knockout mice (N=9). Anova P<0.003. * indicates P<0.05 versus vehicle-control-treated mice, Student’s t-test. (E) Left panel: representative photomicrograph of grade 2 cryptitis and mucosal thickening (on a 0–4 scale). Right panel: normal colon. Scale bars=100 μm. (F) Graph of mean murine endoscopic index of colitis severity score (MEICS) in same mice as in (C). Anova P<10−6. * indicates P<0.024 in daily comparisons to vehicle-control-treated mice, Student’s t-test. (G) Graph of mean total colon cryptitis score (0–16 scale) on study day 8 for DSS treated mice in cohorts of: vehicle-control-treated mice (N=7), SW033291-treated mice (5 mg/kg IP twice daily) (N=8), SW033291-treated mice (10 mg/kg IP twice daily) (N=8), and 15-PGDH knockout mice (N=6). Anova P<0.0005. * indicates P<0.022 versus vehicle-control-treated mice, Student’s t-test. All graphs show means +/− SEM.

