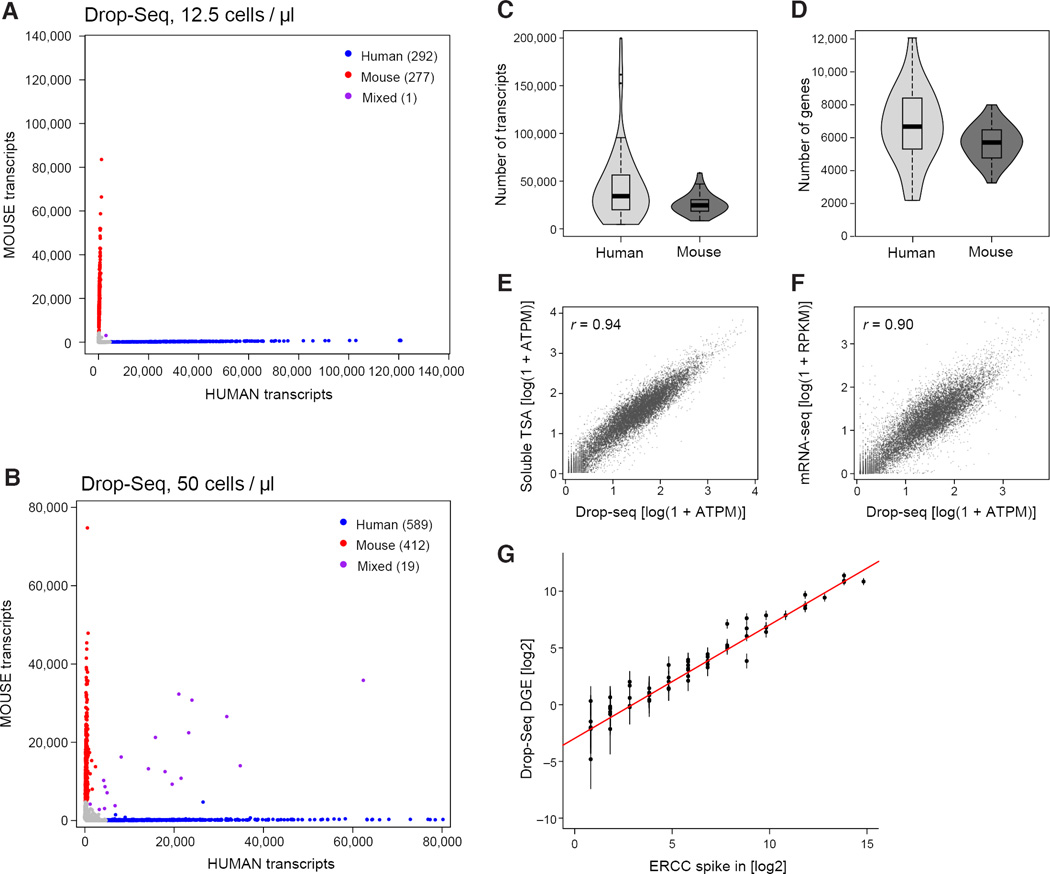
Figure 3. Critical evaluation of Drop-Seq using species-mixing experiments.
(A,B) Drop-Seq analysis of mixutres of mouse and human cells. Mixtures of human (HEK) and mouse (3T3) cells were analyzed by Drop-Seq at the concentrations shown. The scatter plot shows the number of human and mouse transcripts associating to each STAMP. Blue dots indicate STAMPs that were designated from these data as human-specifiic (average of 99% human transcripts); red dots indicate STAMPs that were mouse-specific (average 99%). At the lower cell concentration, one STAMP barcode (of 570) associated with a mixture of human and mouse transcripts (panel A, purple). At the higher cell concentration, about 1.9% of STAMP barcodes associated with mouse-human mixtures (panel B). Data for other cell concentrations and a different single-cell analysis platform are in Figures S3B and S3C.
(C,D) Sensitivity analysis of Drop-Seq at high read-depth. Violin plots show the distribution of the number of transcripts (C, scored by UMIs) and genes (D) detected per cell for 54 HEK (human) STAMPs (blue) and 28 3T3 (mouse) STAMPs (green) that were sequenced to a mean read depth of 737,240 high-quality aligned reads per cell.
(E,F) Correlation between gene expression measurements in Drop-Seq and non-single-cell RNA-seq methods. Comparison of Drop-Seq gene expression measurements (averaged across 550 STAMPs) to measurements from bulk RNA analyzed by: (E) an in-solution template switch amplification (TSA) procedure similar to Smart-Seq2 (Picelli et al., 2013) (Extended Experimental Procedures); and (F) Illumina TruSeq mRNA-Seq. All comparisons involve RNA derived from the same cell culture flask (3T3 cells). All expression counts were converted to average transcripts per million (ATPM) and plotted as log (1+ATPM).
(G) Quantitation of Drop-Seq capture efficiency by ERCC spike-ins. Drop-Seq was performed with ERCC control synthetic RNA at an estimated concentration of 100,000 ERCC RNA molecules per droplet. 84 beads were sequenced at a mean depth of 2.4 million reads, aligned to the ERCC reference sequences, and UMIs counted for each ERCC species, after applying a stringent down-correction for potential sequencing errors (Table S1 and Extended Experimental Procedures). For each ERCC RNA species above an average concentration of one molecule per droplet, the predicted number of molecules per droplet was plotted in log space (x-axis), versus the actual number of molecules detected per droplet by Drop-Seq, also in log space (y-axis). The intercept of a regression line, constrained to have a slope of 1 and fitted to the seven highest points, was used to estimate a conversion factor (0.128). A second estimation, using the average number of detected transcripts divided by the number of ERCC molecules used (100,000), yielded a conversion factor of 0.125.

