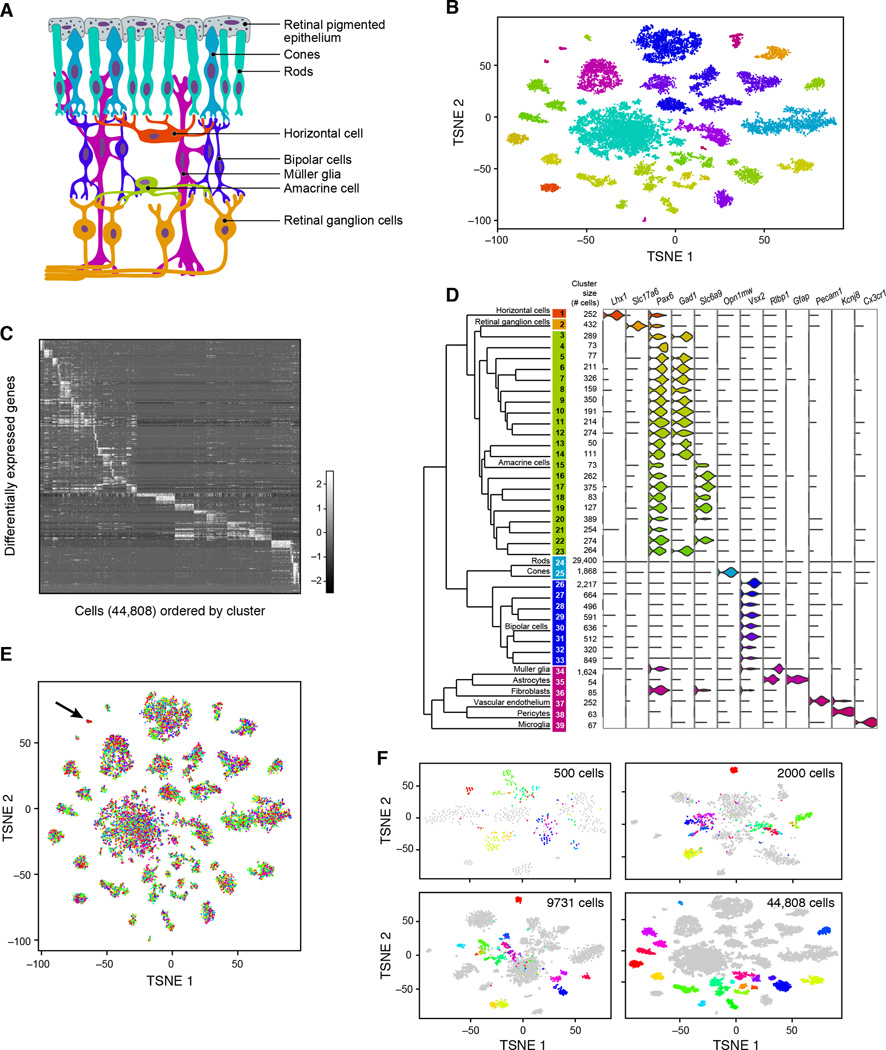
Figure 5. Ab initio reconstruction of retinal cell types from 44,808 single-cell transcription profiles prepared by Drop-Seq.
(A) Schematic representation of major cell classes in the retina. Photoreceptors (rods or cones) detect light and pass information to bipolar cells, which in turn contact retinal ganglion cells that extend axons into other CNS tissues. Amacrine and horizontal cells are retinal interneurons; Müller glia act as support cells for surrounding neurons.
(B) Clustering of 44,808 Drop-Seq single-cell expression profiles into 39 retinal cell populations. The plot shows a two-dimensional representation (tSNE) of global gene expression relationships among 44,808 cells; clusters are colored by cell class, according to Figure 5A.
(C) Differentially expressed genes across 39 retinal cell populations. In this heat map, rows correspond to individual genes found to be selectively upregulated in individual clusters (p < 0.01, Bonferroni corrected); columns are individual cells, ordered by cluster (1–39). Clusters with > 1,000 cells were downsampled to 1,000 cells to prevent them from dominating the plot.
(D) Gene expression similarity relationships among 39 inferred cell populations. Average expression across all detected genes was calculated for each of 39 cell clusters, and the relative (Euclidean) distances between gene-expression patterns for the 39 clusters are represented by a dendrogram. The branches of the dendrogram were annotated by examining the differential expression of known markers for retina cell classes and types. Twelve examples are shown at right, using violin plots to represent the distribution of expression within the clusters. Violin plots for additional genes are in Figure S6A.
(E) Representation of experimental replicates in each cell population. tSNE plot from Figure 2B, with each cell now colored by experimental replicate (for visual clarity, the central rod cluster was downsampled to 10,000 cells). Each of the 7 replicates contributes to all 39 cell populations. Cluster 36 (arrow), in which these replicates are unevenly represented, expressed markers of fibroblasts, which are not native to the retina and are presumably a dissection artifact (see also Figure S6B).
(F) Trajectory of amacrine clustering as a function of number of cells analyzed. Three different downsampled datasets were generated: (1) 500, (2) 2,000, or (3) 9,731 cells (Extended Experimental Procedures). Cells identified as amacrines (clusters 3–23) in the full analysis are here colored by their cluster identities in that analysis. Analyses of smaller numbers of cells incompletely distinguished these subpopulations from one another.

