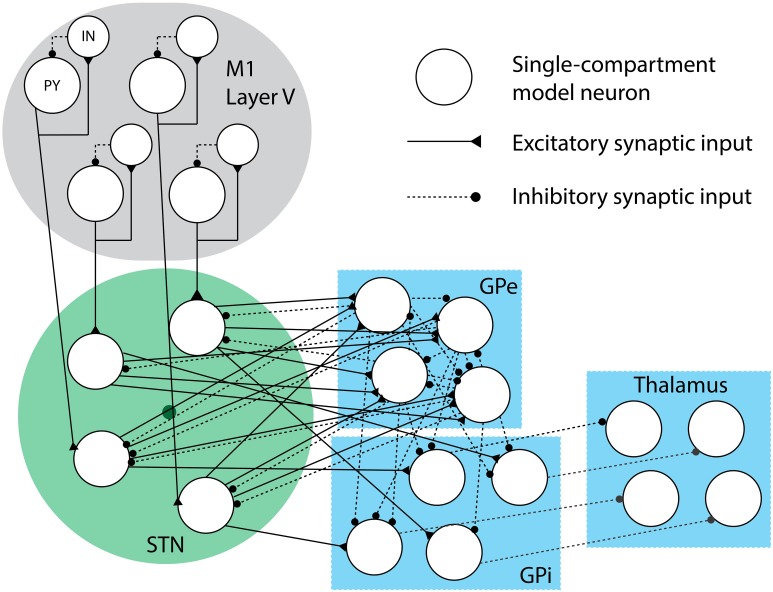
Figure 2.
Synaptic connectivity cartoon. This small-scale network of model neurons depicts the formation of each model nucleus and the synaptic connections. Excitatory synaptic connections are represented with sold lines, while inhibitory synaptic connections are represented with dashed lines. The dark circle in the middle of the STN neurons represents the DBS electrode, which the neurons are randomly distributed around in a sphere of radius r (drawn in green).

