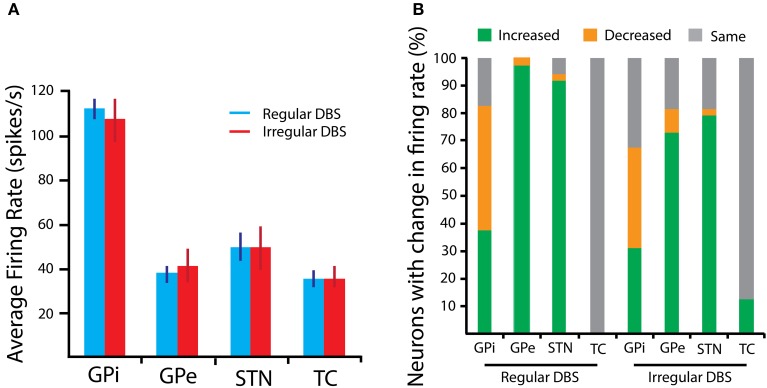
Figure 3.
BG Firing rate properties in response to 130 Hz DBS. (A) The average firing rate, computed across the population of model neurons representing a nucleus, is shown for each structure. Error bars are SEM. (B) The percentage of neurons with either an increased, decreased, or unchanged firing rate relative to the spiking properties in the parkinsonian state is presented. Changes are more heterogeneous in response to the irregular stimulus pulse train.

