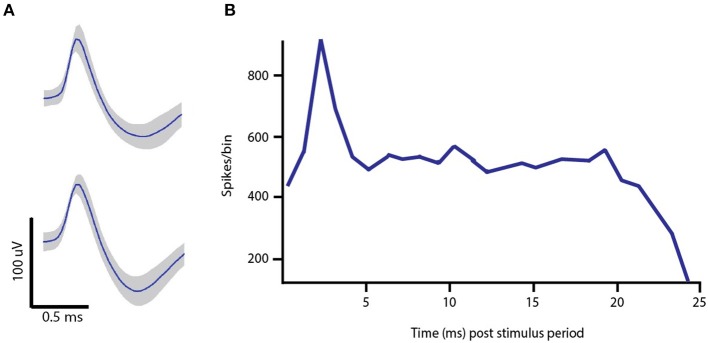
Figure 4.

In vivo single-unit data. (A) Example spike waveforms recorded from Layer V of M1 in the lesioned hemisphere of a 6-OHDA hemi-parkinsonian rat. (B) Peristimulus time histogram of pyramidal cell spiking activity in response to 130 Hz DBS with regularly space current pulses. The peak around 2–3 ms is attributed to the fact that antidromic spikes appear at the cell body with a short, fixed latency following the DBS pulse onset.
