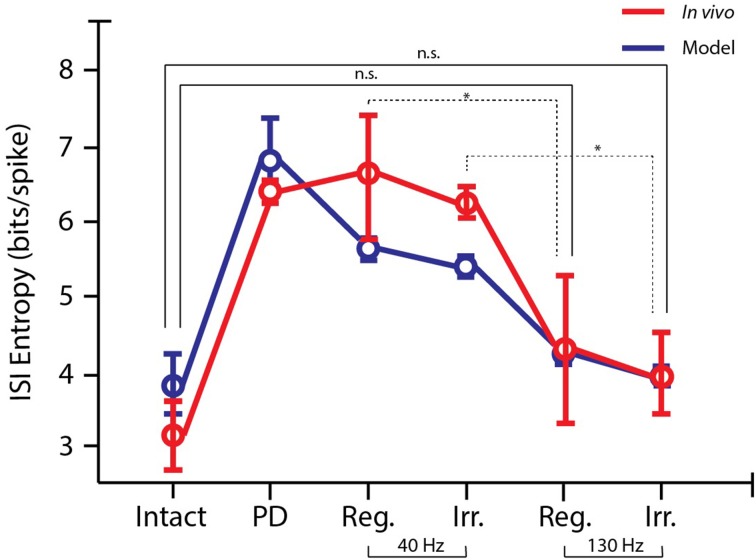
Figure 6.
Entropy of ISIs for in vivo and simulated data. The activity produced by the computational model (n = 50, blue) follows the same trends as the in vivo data (n = 48, red). Spike trains are more bursty in the parkinsonian state, but the bursiness decreases with increasing stimulation frequency (post-hoc LSD: *p < 0.05). 130 Hz regular and irregular DBS both restored the ISI entropy to the level of the intact hemisphere, meaning the ISI entropy was not significantly different (n.s.; post-hoc LSD: p > 0.05).

