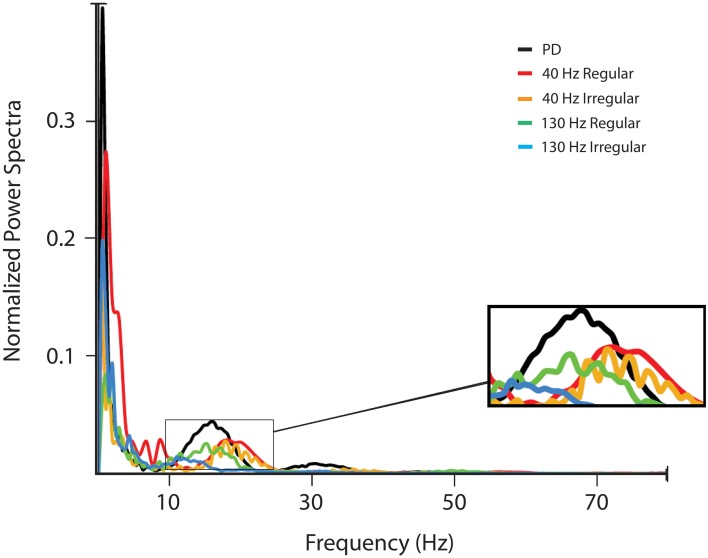
Figure 7.
LFP power spectra. The LFP was filtered using a zero-phase FIR filter with passband 0–200 Hz and the power spectrum of the LFP signal was estimated using multitaper methods (Chronux 2.0) with 9 Slepian data tapers. Power spectra shown are for activity in the lesioned hemisphere of the subjects without stimulation and with four different stimulation signals: 40 Hz with regularly and irregularly space pulse trains, and 130 Hz DBS with regularly and irregularly spaced pulse trains.

