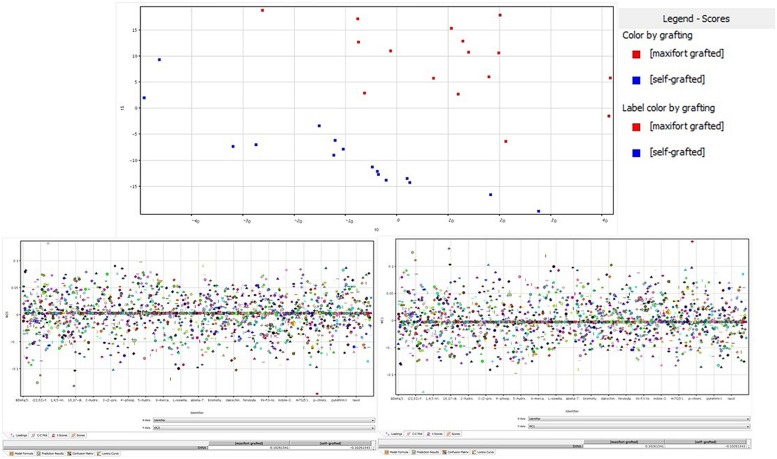
FIGURE 4.
Partial least squares discriminant analysis (PLS-DA) identification of metabolites being significantly altered by grafting. (Upper) panel is the hyperspace plot from the PLS-DA model, while lower panes are the class prediction loadings on first (Left) and second (Right) hyperspace components.

