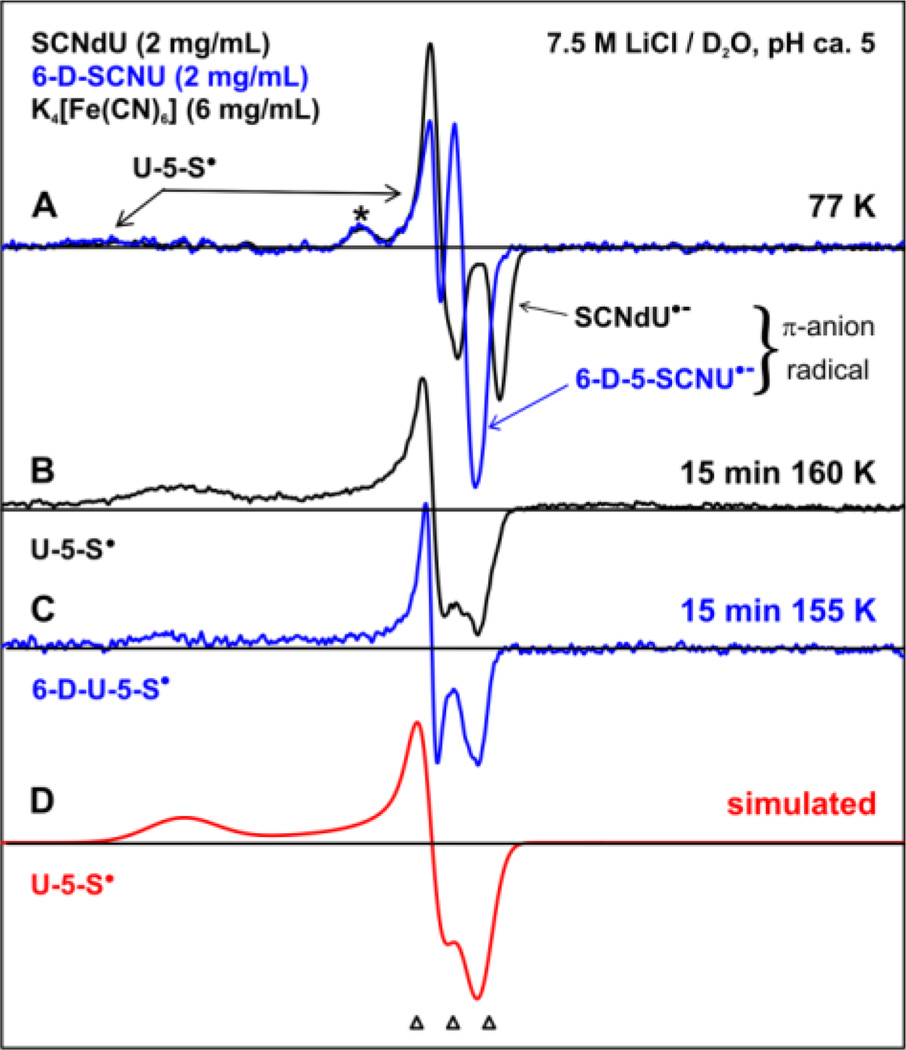
Figure 1.
ESR spectra recorded at 77 K of γ-irradiated (77 K) N2-saturated 7.5 M LiCl/D2O solutions of SCNdU and 6-D-SCNU with a hole scavenger, K4[Fe(CN)6]. (A) The π-anion radical of SCNdU and 6-D-SCNU upon epre− addition. Both spectra also show the line components from U-5-S• (indicated by arrows). (B) U-5-S• spectrum after annealing at 160 K for 15 min. (C) 6-D-U-5-S• spectrum from the 6-D-5-SCNU sample obtained after annealing at 155 K for 15 min. (D) An anisotropic simulation of the spectra (B) and (C) of U-5-S• using g-tensor principal values. The three reference markers (open triangles) show the position of Fremy’s salt resonance with the central marker at g = 2.0056 and 13.09 G marker spacing.

