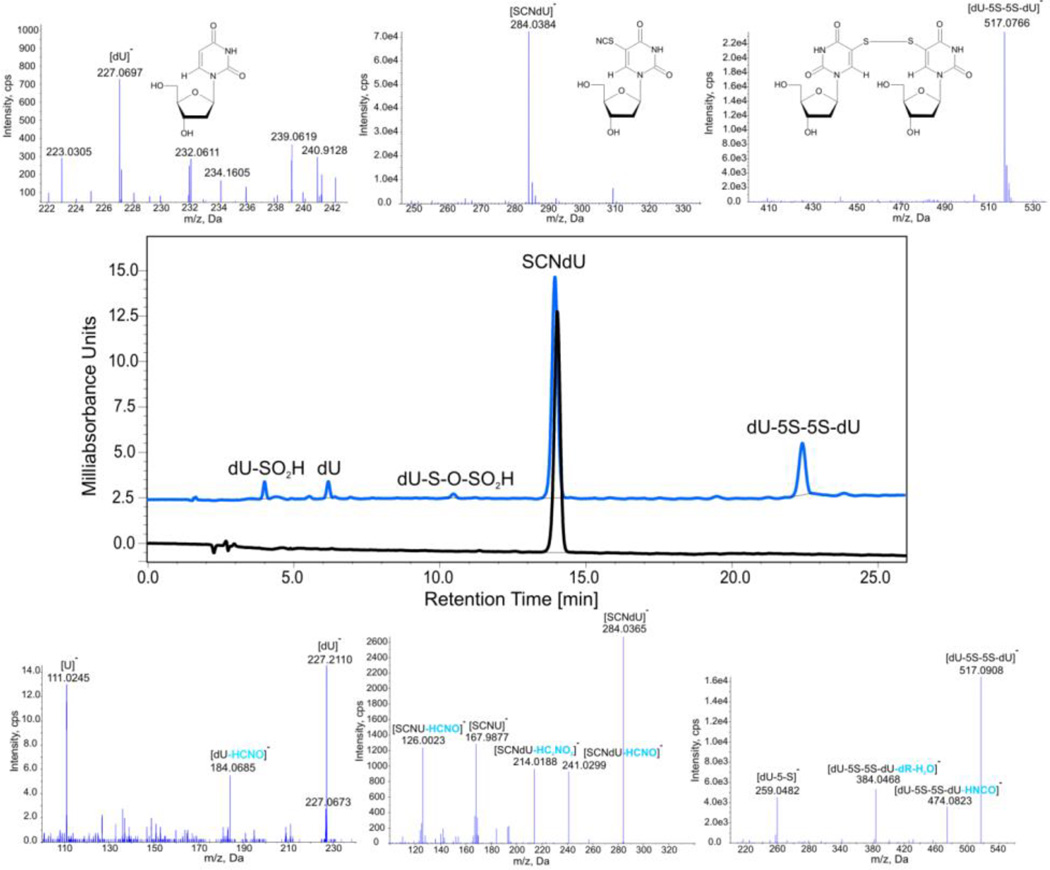
Figure 2.
HPLC and MS analysis of a solution of SCNdU. Middle panel – the HPLC traces of SCNdU before (black) and after (blue) γ-irradiation with a dose of 50 Gy; upper part –the MS spectra (in the negative ionization mode) of the selected HPLC signals; lower panel – the MS/MS spectra of the selected HPLC signals along with ion identities.

