
Figure 3.
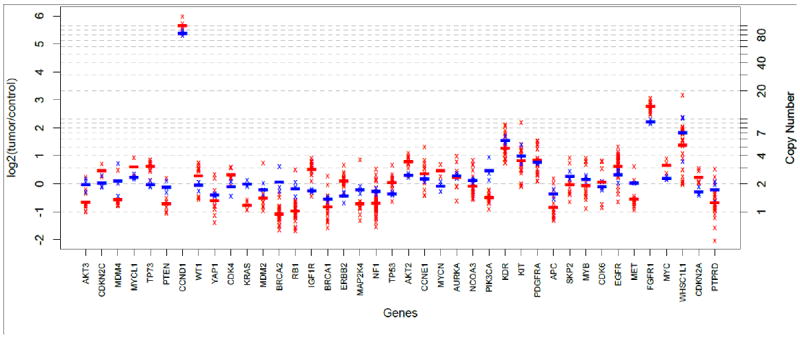
Comparison of copy-number profiles from JAX-CTP™ with NanoString for a squamous cell carcinoma patient sample. Red and blue crosses represent exon (or probe) level log ratios measured by JAX-CTP™ and NanoString respectively. Red and blue lines represent the averages of the exon (or probe) level log ratios measured by JAX-CTP™ and NanoString respectively.