
Figure 4.
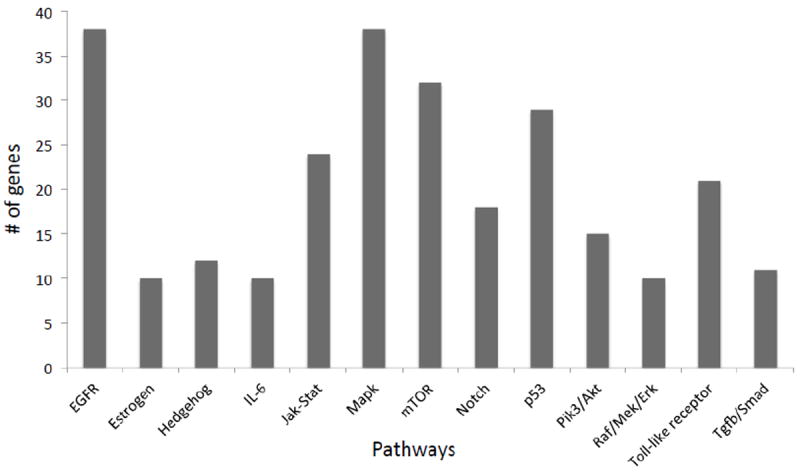
Each bar represents the number of genes (Y axis) of the JAX-CTP™ within each of the described biological pathways (X axis).
Official websites use .gov
A
.gov website belongs to an official
government organization in the United States.
Secure .gov websites use HTTPS
A lock (
) or https:// means you've safely
connected to the .gov website. Share sensitive
information only on official, secure websites.
Each bar represents the number of genes (Y axis) of the JAX-CTP™ within each of the described biological pathways (X axis).