
FIGURE 3.
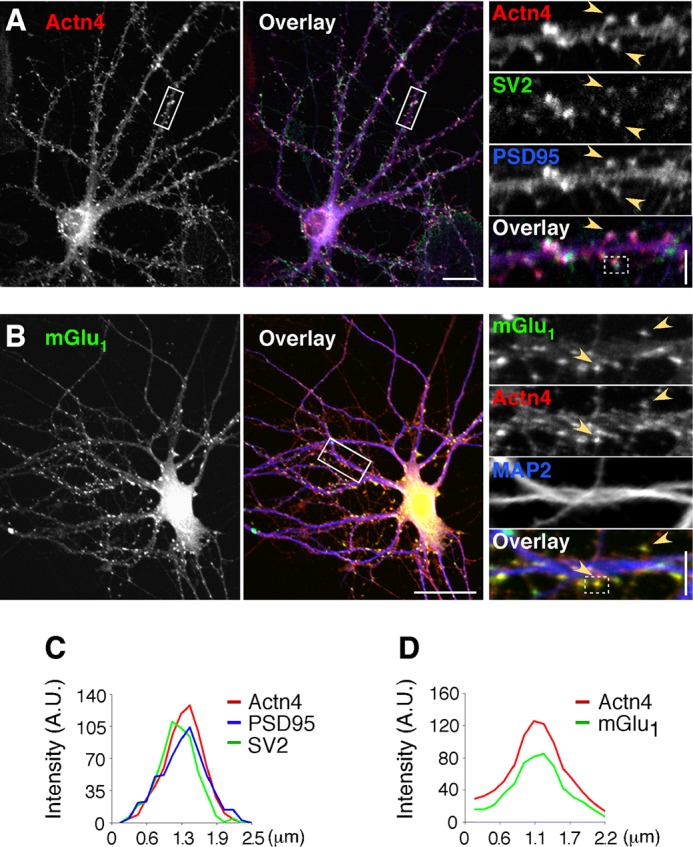
Actn4 is expressed at synapses and colocalizes with mGlu1. A, Actn4 localizes to synapses in hippocampal neurons. Shown are representative confocal images of cells labeled with anti-Actn4, anti-PSD95, and anti-SV2. Left panel, Actn4 alone. Center panel, overlay with PSD95 and SV2. Colocalization appears in white. Scale bar = 20 μm. Right panel, magnified boxed regions. Arrowheads point to areas of colocalization. Scale bar = 5 μm. B, Actn4 colocalizes with mGlu1. Shown are representative images of cells labeled with anti-mGlu1, anti-Actn4, and anti-MAP2. Left panel, mGlu1 alone. Center panel, overlay with Actn4 and MAP2. Scale bar = 35 μm. Right panel, arrowheads point to mGlu1 puncta colocalized with Actn4. Scale bar = 5 μm. C, line scan analysis of fluorescence intensity across a boxed region from the right panel in A. A.U., fluorescence intensity in arbitrary units. D, line scan of a boxed region from the right panel in B.